Getting Started with Tetragon
Quickly get started and learn how to install, deploy and configure it
Getting started
This is the multi-page printable view of this section. Click here to print.
Cilium Tetragon component enables powerful realtime, eBPF-based Security Observability and Runtime Enforcement.
Tetragon detects and is able to react to security-significant events, such as
When used in a Kubernetes environment, Tetragon is Kubernetes-aware - that is, it understands Kubernetes identities such as namespaces, pods and so-on - so that security event detection can be configured in relation to individual workloads.
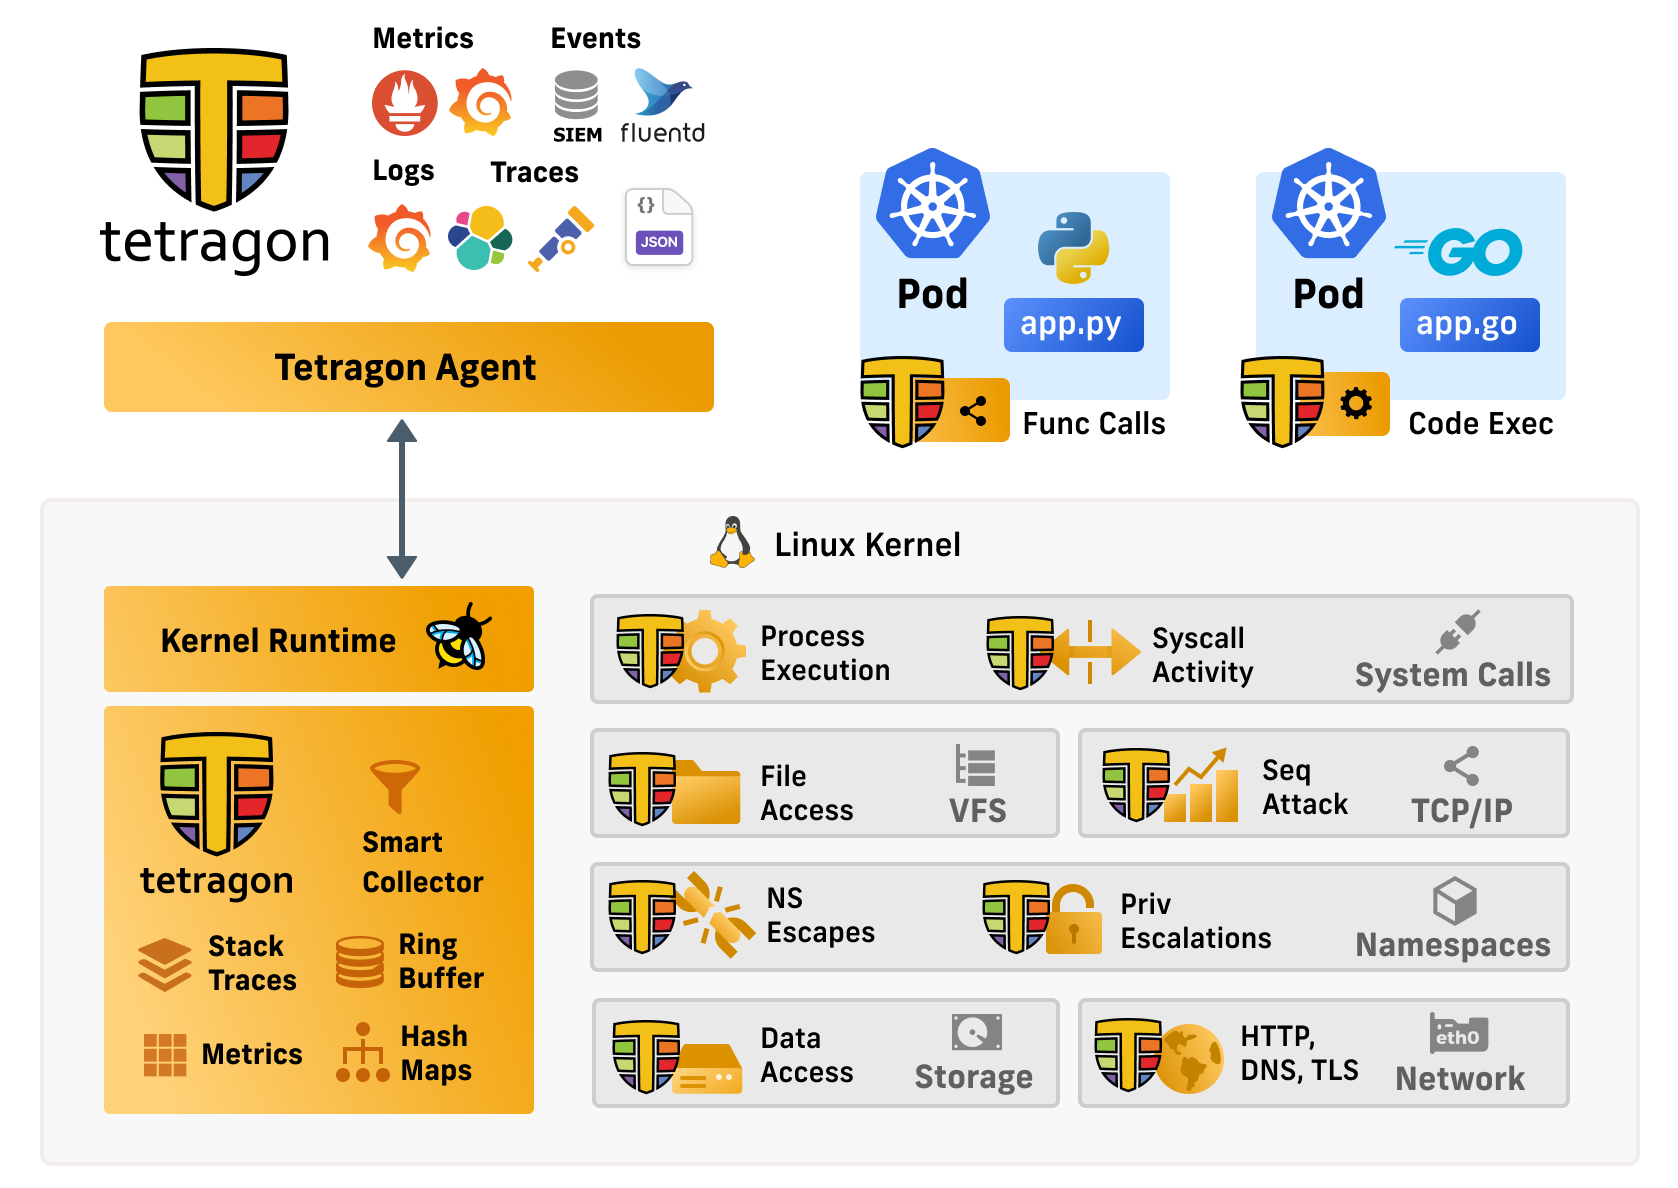
Tetragon Overview Diagram
Tetragon is a runtime security enforcement and observability tool. What this means is Tetragon applies policy and filtering directly in eBPF in the kernel. It performs the filtering, blocking, and reacting to events directly in the kernel instead of sending events to a user space agent.
For an observability use case, applying filters directly in the kernel drastically reduces observation overhead. By avoiding expensive context switching and wake-ups, especially for high frequency events, such as send, read, or write operations, eBPF reduces required resources. Instead, Tetragon provides rich filters (file, socket, binary names, namespace/capabilities, etc.) in eBPF, which allows users to specify the important and relevant events in their specific context, and pass only those to the user-space agent.
Tetragon can hook into any function in the Linux kernel and filter on its arguments, return value, associated metadata that Tetragon collects about processes (e.g., executable names), files, and other properties. By writing tracing policies users can solve various security and observability use cases. We provide a number of examples for these in the repository and highlight some below in the ‘Getting Started Guide’, but users are encouraged to create new policies that match their use cases. The examples are just that, jumping off points that users can then use to create new and specific policy deployments even potentially tracing kernel functions we did not consider. None of the specifics about which functions are traced and what filters are applied are hard-coded in the engine itself.
Critically, Tetragon allows hooking deep in the kernel where data structures can not be manipulated by user space applications avoiding common issues with syscall tracing where data is incorrectly read, maliciously altered by attackers, or missing due to page faults and other user/kernel boundary errors.
Many of the Tetragon developers are also kernel developers. By leveraging this knowledge base Tetragon has created a set of tracing policies that can solve many common observability and security use cases.
Tetragon, through eBPF, has access to the Linux kernel state. Tetragon can then join this kernel state with Kubernetes awareness or user policy to create rules enforced by the kernel in real time. This allows annotating and enforcing process namespace and capabilities, sockets to processes, process file descriptor to filenames and so on. For example, when an application changes its privileges we can create a policy to trigger an alert or even kill the process before it has a chance to complete the syscall and potentially run additional syscalls.
If you don’t have a Kubernetes Cluster yet, you can use the instructions below to create a Kubernetes cluster locally or using a managed Kubernetes service:
The following commands create a single node Kubernetes cluster using Google
Kubernetes Engine. See
Installing Google Cloud SDK for
instructions on how to install gcloud and prepare your account.
export NAME="$(whoami)-$RANDOM"
export ZONE="us-west2-a"
gcloud container clusters create "${NAME}" --zone ${ZONE} --num-nodes=1
gcloud container clusters get-credentials "${NAME}" --zone ${ZONE}
The following commands create a single node Kubernetes cluster using Azure
Kubernetes Service. See
Azure Cloud CLI
for instructions on how to install az and prepare your account.
export NAME="$(whoami)-$RANDOM"
export AZURE_RESOURCE_GROUP="${NAME}-group"
az group create --name "${AZURE_RESOURCE_GROUP}" -l westus2
az aks create --resource-group "${AZURE_RESOURCE_GROUP}" --name "${NAME}"
az aks get-credentials --resource-group "${AZURE_RESOURCE_GROUP}" --name "${NAME}"
The following commands create a single node Kubernetes cluster with eksctl using Amazon Elastic
Kubernetes Service. See eksctl installation
for instructions on how to install eksctl and prepare your account.
export NAME="$(whoami)-$RANDOM"
eksctl create cluster --name "${NAME}"
Tetragon’s correct operation depends on access to the host /proc filesystem. The following steps
configure kind and Tetragon accordingly when using a Linux system. The following commands create a single node Kubernetes cluster using kind that is properly configured for Tetragon.
cat <<EOF > kind-config.yaml
apiVersion: kind.x-k8s.io/v1alpha4
kind: Cluster
nodes:
  - role: control-plane
    extraMounts:
      - hostPath: /proc
        containerPath: /procHost
EOF
kind create cluster --config kind-config.yaml
EXTRA_HELM_FLAGS=(--set tetragon.hostProcPath=/procHost) # flags for helm install
The commands in this Getting Started guide assume you use a single-node Kubernetes cluster. If you use a cluster with multiple nodes, be aware that some of the commands shown need to be modified. We call out these changes where they are necessary.
To install and deploy Tetragon, run the following commands:
helm repo add cilium https://helm.cilium.io
helm repo update
helm install tetragon ${EXTRA_HELM_FLAGS[@]} cilium/tetragon -n kube-system
kubectl rollout status -n kube-system ds/tetragon -w
By default, Tetragon will filter kube-system events to reduce noise in the event logs. See concepts and advanced configuration to configure these parameters.
To explore Tetragon it is helpful to have a sample workload. Here we use Cilium’s demo application, but any workload would work equally well:
kubectl create -f https://raw.githubusercontent.com/cilium/cilium/v1.15.3/examples/minikube/http-sw-app.yaml
Before going forward, verify that all pods are up and running - it might take several seconds for some pods to satisfy all the dependencies:
kubectl get pods
The output should be similar to this:
NAME                         READY   STATUS    RESTARTS   AGE
deathstar-6c94dcc57b-7pr8c   1/1     Running   0          10s
deathstar-6c94dcc57b-px2vw   1/1     Running   0          10s
tiefighter                   1/1     Running   0          10s
xwing                        1/1     Running   0          10s
Check for execution events.
This guide has been tested on Ubuntu 22.04 and 22.10 with respectively kernel
5.15.0 and 5.19.0 on amd64 and arm64 but
any recent distribution
shipping with a relatively recent kernel should work. See the FAQ for further details on
the recommended kernel versions.
Note that you cannot run Tetragon using Docker Desktop on macOS because of a limitation of the Docker Desktop Linux virtual machine. Learn more about this issue and how to run Tetragon on a Mac computer in this section of the FAQ page.
The easiest way to start experimenting with Tetragon is to run it via Docker using the released container images.
docker run -d --name tetragon --rm --pull always \
    --pid=host --cgroupns=host --privileged             \
    -v /sys/kernel/btf/vmlinux:/var/lib/tetragon/btf    \
    quay.io/cilium/tetragon:v1.7.0
This will start Tetragon in a privileged container running in the background. Running Tetragon as a privileged container is required to load and attach BPF programs. See the Installation and Configuration section for more details.
To explore Tetragon it is helpful to have a sample workload. You can use Cilium’s demo application with this Docker Compose file, but any workload would work equally well:
curl -LO https://github.com/cilium/tetragon/raw/main/examples/quickstart/docker-compose.yaml
docker compose -f docker-compose.yaml up -d
You can use docker container ls to verify that the containers are up and
running. It might take a short amount of time for the container images to
download.
CONTAINER ID   IMAGE                             COMMAND                  CREATED          STATUS          PORTS                                   NAMES
cace79752d94   quay.io/cilium/json-mock:v1.3.8   "bash /run.sh"           34 seconds ago   Up 33 seconds                                           starwars-xwing-1
4f8422b43b5b   quay.io/cilium/json-mock:v1.3.8   "bash /run.sh"           34 seconds ago   Up 33 seconds                                           starwars-tiefighter-1
7b60618ca8bd   quay.io/cilium/starwars:v2.1      "/starwars-docker --…"   34 seconds ago   Up 33 seconds   0.0.0.0:8080->80/tcp, :::8080->80/tcp   starwars-deathstar-1
Check for execution events.
At the core of Tetragon is the tracking of all executions in a Kubernetes cluster, virtual machines, and bare metal systems. This creates the foundation that allows Tetragon to attribute all system behavior back to a specific binary and its associated metadata (container, Pod, Node, and cluster).
Tetragon exposes the execution events over JSON logs and GRPC stream. The user can then observe all executions in the system.
Use the following instructions to observe execution events. These instructions assume you have deployed the Cilium demo application in your environment.
For a single node Kubernetes cluster, you can target the Tetragon DaemonSet with
a kubectl exec command:
kubectl exec -ti -n kube-system ds/tetragon -c tetragon -- tetra getevents -o compact --pods xwing
This command runs tetra getevents -o compact --pods xwing in the single Pod
that is a member of the Tetragon DaemonSet. Because there is only a single node
in the cluster, it is guaranteed that the “xwing” Pod will also be running on
the same node and that Tetragon will be able to capture and report execution
events.
In a cluster with multiple nodes, you will need to ensure that the Tetragon Pod you use is located on the same node as the “xwing” Pod, so that it can capture the execution events.
You can use this command to get the name of the Tetragon Pod that is on the same Kubernetes node as the “xwing” Pod:
POD=$(kubectl -n kube-system get pods -l 'app.kubernetes.io/name=tetragon' -o name --field-selector spec.nodeName=$(kubectl get pod xwing -o jsonpath='{.spec.nodeName}'))
Once you have the identified the matching Pod, then target it with a kubectl exec to run the tetra getevents command.
kubectl exec -ti -n kube-system $POD -c tetragon -- tetra getevents -o compact --pods xwing
Because the Tetragon Pod where you are running tetra getevents in on the same
node as the “xwing” Pod, the command will return the execution events captured
by Tetragon.
docker exec tetragon tetra getevents -o compact
The tetra get-events -o compact command returns a compact form of the execution
events. To trigger an execution event, you will run a curl command inside the
“xwing” Pod/container.
kubectl exec -ti xwing -- bash -c 'curl https://ebpf.io/applications/#tetragon'kubectl exec -ti xwing -- bash -c 'curl https://ebpf.io/applications/#tetragon'docker exec -ti starwars-xwing-1 curl https://ebpf.io/applications/#tetragonThe CLI will print a compact form of the event to the terminal similar to the following output. The example output below is from Kubernetes; the Docker output is very similar.
🚀 process default/xwing /bin/bash -c "curl https://ebpf.io/applications/#tetragon"
🚀 process default/xwing /usr/bin/curl https://ebpf.io/applications/#tetragon
💥 exit    default/xwing /usr/bin/curl https://ebpf.io/applications/#tetragon 60
The compact execution event contains the event type, the pod name, the binary
and the args. The exit event will include the return code; in the case of the
curl command above, the return code was 60.
For the complete execution event in JSON format remove the -o compact option
from the tetra getevents command.
kubectl exec -ti -n kube-system ds/tetragon -c tetragon -- tetra getevents --pods xwingkubectl exec -ti -n kube-system $POD -c tetragon -- tetra getevents --pods xwingdocker exec -ti tetragon tetra geteventsThe complete execution event includes a lot more details related to the binary
and event. See below for a full example of the execution event generated by the
curl command used above. In a Kubernetes environment this will include the
Kubernetes metadata include the Pod, Container, Namespaces, and Labels, among
other useful metadata.
{
  "process_exec": {
    "process": {
      "exec_id": "Z2tlLWpvaG4tNjMyLWRlZmF1bHQtcG9vbC03MDQxY2FjMC05czk1OjEzNTQ4Njc0MzIxMzczOjUyNjk5",
      "pid": 52699,
      "uid": 0,
      "cwd": "/",
      "binary": "/usr/bin/curl",
      "arguments": "https://ebpf.io/applications/#tetragon",
      "flags": "execve rootcwd",
      "start_time": "2023-10-06T22:03:57.700327580Z",
      "auid": 4294967295,
      "pod": {
        "namespace": "default",
        "name": "xwing",
        "container": {
          "id": "containerd://551e161c47d8ff0eb665438a7bcd5b4e3ef5a297282b40a92b7c77d6bd168eb3",
          "name": "spaceship",
          "image": {
            "id": "docker.io/tgraf/netperf@sha256:8e86f744bfea165fd4ce68caa05abc96500f40130b857773186401926af7e9e6",
            "name": "docker.io/tgraf/netperf:latest"
          },
          "start_time": "2023-10-06T21:52:41Z",
          "pid": 49
        },
        "pod_labels": {
          "app.kubernetes.io/name": "xwing",
          "class": "xwing",
          "org": "alliance"
        },
        "workload": "xwing"
      },
      "docker": "551e161c47d8ff0eb665438a7bcd5b4",
      "parent_exec_id": "Z2tlLWpvaG4tNjMyLWRlZmF1bHQtcG9vbC03MDQxY2FjMC05czk1OjEzNTQ4NjcwODgzMjk5OjUyNjk5",
      "tid": 52699
    },
    "parent": {
      "exec_id": "Z2tlLWpvaG4tNjMyLWRlZmF1bHQtcG9vbC03MDQxY2FjMC05czk1OjEzNTQ4NjcwODgzMjk5OjUyNjk5",
      "pid": 52699,
      "uid": 0,
      "cwd": "/",
      "binary": "/bin/bash",
      "arguments": "-c \"curl https://ebpf.io/applications/#tetragon\"",
      "flags": "execve rootcwd clone",
      "start_time": "2023-10-06T22:03:57.696889812Z",
      "auid": 4294967295,
      "pod": {
        "namespace": "default",
        "name": "xwing",
        "container": {
          "id": "containerd://551e161c47d8ff0eb665438a7bcd5b4e3ef5a297282b40a92b7c77d6bd168eb3",
          "name": "spaceship",
          "image": {
            "id": "docker.io/tgraf/netperf@sha256:8e86f744bfea165fd4ce68caa05abc96500f40130b857773186401926af7e9e6",
            "name": "docker.io/tgraf/netperf:latest"
          },
          "start_time": "2023-10-06T21:52:41Z",
          "pid": 49
        },
        "pod_labels": {
          "app.kubernetes.io/name": "xwing",
          "class": "xwing",
          "org": "alliance"
        },
        "workload": "xwing"
      },
      "docker": "551e161c47d8ff0eb665438a7bcd5b4",
      "parent_exec_id": "Z2tlLWpvaG4tNjMyLWRlZmF1bHQtcG9vbC03MDQxY2FjMC05czk1OjEzNTQ4NjQ1MjQ1ODM5OjUyNjg5",
      "tid": 52699
    }
  },
  "node_name": "gke-john-632-default-pool-7041cac0-9s95",
  "time": "2023-10-06T22:03:57.700326678Z"
}
Execution events are the most basic event Tetragon can produce. To see how to use tracing policies to enable file monitoring see the File Access Monitoring section of the Getting Started guide. To see a network policy check the Networking Monitoring section.
Tracing policies can be added to Tetragon through YAML configuration files that extend Tetragon’s base execution tracing capabilities. These policies perform filtering in kernel to ensure only interesting events are published to userspace from the BPF programs running in kernel. This ensures overhead remains low even on busy systems.
The instructions below extend the example from Execution Monitoring
with a policy to monitor sensitive files in Linux. The policy used is
file_monitoring.yaml,
which you can review and extend as needed. Files monitored here serve as a good
base set of files.
To apply the policy in Kubernetes, use kubectl. In Kubernetes, the policy
references a Custom Resource Definition (CRD) installed by Tetragon. Docker uses
the same YAML configuration file as Kubernetes, but this file is loaded from
disk when the Docker container is launched.
Note that these instructions assume you’ve installed the demo application, as outlined in either the Quick Kubernetes Install or the Quick Docker Install section.
kubectl apply -f https://raw.githubusercontent.com/cilium/tetragon/main/examples/quickstart/file_monitoring.yamlkubectl apply -f https://raw.githubusercontent.com/cilium/tetragon/main/examples/quickstart/file_monitoring.yamlwget https://raw.githubusercontent.com/cilium/tetragon/main/examples/quickstart/file_monitoring.yaml
docker stop tetragon
docker run -d --name tetragon --rm --pull always \
--pid=host --cgroupns=host --privileged \
-v ${PWD}/file_monitoring.yaml:/etc/tetragon/tetragon.tp.d/file_monitoring.yaml \
-v /sys/kernel/btf/vmlinux:/var/lib/tetragon/btf \
quay.io/cilium/tetragon:v1.7.0With the tracing policy applied you can attach tetra to observe events again:
kubectl exec -ti -n kube-system ds/tetragon -c tetragon -- tetra getevents -o compact --pods xwingPOD=$(kubectl -n kube-system get pods -l 'app.kubernetes.io/name=tetragon' -o name --field-selector spec.nodeName=$(kubectl get pod xwing -o jsonpath='{.spec.nodeName}'))
kubectl exec -ti -n kube-system $POD -c tetragon -- tetra getevents -o compact --pods xwingdocker exec -ti tetragon tetra getevents -o compactTo generate an event, try to read a sensitive file referenced in the policy.
kubectl exec -ti xwing -- bash -c 'cat /etc/shadow'kubectl exec -ti xwing -- bash -c 'cat /etc/shadow'cat /etc/shadowThis will generate a read event (Docker events will omit Kubernetes metadata shown below) that looks something like this:
🚀 process default/xwing /bin/bash -c "cat /etc/shadow"
🚀 process default/xwing /bin/cat /etc/shadow
📚 read    default/xwing /bin/cat /etc/shadow
💥 exit    default/xwing /bin/cat /etc/shadow 0
Per the tracing policy, Tetragon generates write events in responses to attempts
to write in sensitive directories (for example, attempting to write in the
/etc directory).
kubectl exec -ti xwing -- bash -c 'echo foo >> /etc/bar'kubectl exec -ti xwing -- bash -c 'echo foo >> /etc/bar'echo foo >> /etc/barIn response, you will see output similar to the following (Docker events do not include the Kubernetes metadata shown here).
🚀 process default/xwing /bin/bash -c "echo foo >>  /etc/bar"
📝 write   default/xwing /bin/bash /etc/bar
📝 write   default/xwing /bin/bash /etc/bar
💥 exit    default/xwing /bin/bash -c "echo foo >>  /etc/bar
To explore tracing policies for networking see the Networking Monitoring section of the Getting Started guide. To dive into the details of policies and events please see the Concepts section of the documentation.
In addition to file access monitoring, Tetragon’s tracing policies also support monitoring network access. In this section, you will see how to monitor network traffic to “external” destinations (destinations that are outside the Kubernetes cluster or external to the Docker host where Tetragon is running). These instructions assume you already have Tetragon running in either Kubernetes or Docker, and that you have deployed the Cilium demo application.
First, you’ll need to find the pod CIDR and service CIDR in use. In many cases the pod CIDR is relatively easy to find.
export PODCIDR=`kubectl get nodes -o jsonpath='{.items[*].spec.podCIDR}'`
You can fetch the service CIDR from the cluster in some environments. When working with managed Kubernetes offerings (AKS, EKS, or GKE) you will need the environment variables used when you created the cluster.
export SERVICECIDR=$(gcloud container clusters describe ${NAME} --zone ${ZONE} | awk '/servicesIpv4CidrBlock/ { print $2; }')export SERVICECIDR=$(kubectl describe pod -n kube-system -l component=kube-apiserver | awk -F= '/--service-cluster-ip-range/ {print $2; }')export SERVICECIDR=$(aws eks describe-cluster --name ${NAME} | jq -r '.cluster.kubernetesNetworkConfig.serviceIpv4Cidr')export SERVICECIDR=$(az aks show --name ${NAME} --resource-group ${AZURE_RESOURCE_GROUP} | jq -r '.networkProfile.serviceCidr)Once you have this information, you can customize a policy to exclude network
traffic to the networks stored in the PODCIDR and SERVICECIDR environment
variables. Use envsubst to do this, and then apply the policy to your
Kubernetes cluster with kubectl apply:
wget https://raw.githubusercontent.com/cilium/tetragon/main/examples/quickstart/network_egress_cluster.yaml
envsubst < network_egress_cluster.yaml | kubectl apply -f -
Once the tracing policy is applied, you can attach tetra to observe events
again:
kubectl exec -ti -n kube-system ds/tetragon -c tetragon -- tetra getevents -o compact --pods xwing --processes curlPOD=$(kubectl -n kube-system get pods -l 'app.kubernetes.io/name=tetragon' -o name --field-selector spec.nodeName=$(kubectl get pod xwing -o jsonpath='{.spec.nodeName}'))
kubectl exec -ti -n kube-system $POD -c tetragon -- tetra getevents -o compact --pods xwing --processes curlThen execute a curl command in the “xwing” Pod to access one of our favorite
sites.
kubectl exec -ti xwing -- bash -c 'curl https://ebpf.io/applications/#tetragon'
You will observe a connect event being reported in the output of the tetra getevents command:
🚀 process default/xwing /usr/bin/curl https://ebpf.io/applications/#tetragon
🔌 connect default/xwing /usr/bin/curl tcp 10.32.0.19:33978 -> 104.198.14.52:443
💥 exit    default/xwing /usr/bin/curl https://ebpf.io/applications/#tetragon 60
You can confirm in-kernel BPF filters are not producing events for in-cluster
traffic by issuing a curl to one of our services and noting there is no
connect event.
kubectl exec -ti xwing -- bash -c 'curl -s -XPOST deathstar.default.svc.cluster.local/v1/request-landing'
The output should be similar to:
Ship landed
You will observe that no new connect events are generated for in-cluster traffic.
However, process and exit events for the curl command will still be reported
due to active execution monitoring.
🚀 process default/xwing /usr/bin/curl -s -XPOST deathstar.default.svc.cluster.local/v1/request-landing
💥 exit    default/xwing /usr/bin/curl -s -XPOST deathstar.default.svc.cluster.local/v1/request-landing 0
Finally, delete the applied TracingPolicy with:
envsubst < network_egress_cluster.yaml | kubectl delete -f -
This example also works easily for local Docker users. However, since Docker
does not have pod CIDR or service CIDR constructs, you will construct a tracing
policy that filters 127.0.0.1 from the Tetragon event log.
First, set the necessary environment variables to the loopback IP address.
export PODCIDR="127.0.0.1/32"
export SERVICECIDR="127.0.0.1/32"
Next, customize the policy using envsubst.
wget https://raw.githubusercontent.com/cilium/tetragon/main/examples/quickstart/network_egress_cluster.yaml
envsubst < network_egress_cluster.yaml > network_egress_cluster_subst.yaml
Finally, start Tetragon with the new policy.
docker stop tetragon
docker run -d --name tetragon --rm --pull always \
  --pid=host --cgroupns=host --privileged               \
  -v ${PWD}/network_egress_cluster_subst.yaml:/etc/tetragon/tetragon.tp.d/network_egress_cluster_subst.yaml \
  -v /sys/kernel/btf/vmlinux:/var/lib/tetragon/btf      \
  quay.io/cilium/tetragon:v1.7.0
Once Tetragon is running, use docker exec to run the tetra getevents command
and log the output to your terminal.
docker exec -ti tetragon tetra getevents -o compact
Now remote TCP connections will be logged, but connections to the localhost
address are filtered out by Tetragon. You can see this by executing a curl
command to generate a remote TCP connect.
curl https://ebpf.io/applications/#tetragon
This produces the following output:
🚀 process  /usr/bin/curl https://ebpf.io/applications/#tetragon
🔌 connect  /usr/bin/curl tcp 192.168.1.190:36124 -> 104.198.14.52:443
💥 exit     /usr/bin/curl https://ebpf.io/applications/#tetragon 0
So far you have installed Tetragon and used a couple policies to monitor sensitive files and provide network auditing for connections outside your own cluster and node. Both these cases highlight the value of in-kernel filtering. Another benefit of in-kernel filtering is you can add enforcement to the policies to not only alert via a log entry, but to block the operation in kernel and/or kill the application attempting the operation.
To learn more about policies and events Tetragon can implement review the Concepts section.
Tetragon’s tracing policies support monitoring kernel functions to report
events, such as file access events or network connection events, as well as enforcing restrictions on those same kernel functions. Using in-kernel
filtering in Tetragon provides a key performance improvement by limiting events
from kernel to user space. In-kernel filtering
also enables Tetragon to enforce policy restrictions at the kernel level. For
example, by issuing a SIGKILL to a process when a policy violation is
detected, the process will not continue to run. If the policy enforcement is
triggered through a syscall this means the application will not return from the
syscall and will be terminated.
In this section, you will add network and file policy enforcement on top of the Tetragon functionality (execution, file tracing, and network tracing policy) you’ve already deployed in this Getting Started guide. Specifically, you will:
For specific implementation details refer to the Enforcement concept section.
In this use case you will use a Tetragon tracing policy to block TCP connections outside the Kubernetes cluster where Tetragon is running. The Tetragon policy is namespaced, limiting the scope of the enforcement policy to just the “default” namespace where you installed the demo application in the Quick Kubernetes Install section.
The policy you will use is very similar to the policy you used in the Network Monitoring section, but with enforcement enabled. Although this policy does not use them, Tetragon tracing policies support including Kubernetes filters, such as namespaces and labels, so you can limit a policy to targeted namespaces and Pods. This is critical for effective policy segmentation.
First, ensure you have the proper Pod CIDR captured for use later:
export PODCIDR=`kubectl get nodes -o jsonpath='{.items[*].spec.podCIDR}'`
You will also need to capture the service CIDR for use in customizing the policy. When working with managed Kubernetes offerings (AKS, EKS, or GKE) you will need the environment variables used when you created the cluster.
export SERVICECIDR=$(gcloud container clusters describe ${NAME} --zone ${ZONE} | awk '/servicesIpv4CidrBlock/ { print $2; }')export SERVICECIDR=$(kubectl describe pod -n kube-system kube-apiserver-kind-control-plane | awk -F= '/--service-cluster-ip-range/ {print $2; }')export SERVICECIDR=$(aws eks describe-cluster --name ${NAME} | jq -r '.cluster.kubernetesNetworkConfig.serviceIpv4Cidr')export SERVICECIDR=$(az aks show --name ${NAME} --resource-group ${AZURE_RESOURCE_GROUP} | jq -r '.networkProfile.serviceCidr)When you have captured the Pod CIDR and Service CIDR, then you can customize and
apply the enforcement policy. (If you installed the demo application in a different
namespace than the default namespace, adjust the kubectl apply command
accordingly.)
wget https://raw.githubusercontent.com/cilium/tetragon/main/examples/quickstart/network_egress_cluster_enforce.yaml
envsubst < network_egress_cluster_enforce.yaml | kubectl apply -n default -f -
With the enforcement policy applied, run the tetra getevents command to observe
events.
kubectl exec -ti -n kube-system ds/tetragon -c tetragon -- tetra getevents -o compact --pods xwingPOD=$(kubectl -n kube-system get pods -l 'app.kubernetes.io/name=tetragon' -o name --field-selector spec.nodeName=$(kubectl get pod xwing -o jsonpath='{.spec.nodeName}'))
kubectl exec -ti -n kube-system $POD -c tetragon -- tetra getevents -o compact --pods xwingTo generate an event that Tetragon will report, use curl to connect to a
site outside the Kubernetes cluster:
kubectl exec -ti xwing -- bash -c 'curl https://ebpf.io/applications/#tetragon'
The command returns an error code because the egress TCP connects are blocked.
The tetra CLI will print the curl and annotate that the process that was issued
a SIGKILL.
command terminated with exit code 137
Making network connections to destinations inside the cluster will work as expected:
kubectl exec -ti xwing -- bash -c 'curl -s -XPOST deathstar.default.svc.cluster.local/v1/request-landing'
The successful internal connection is filtered and will not be shown. The
tetra getevents output from the two curl commands should look something like
this:
🚀 process default/xwing /bin/bash -c "curl https://ebpf.io/applications/#tetragon"
🚀 process default/xwing /usr/bin/curl https://ebpf.io/applications/#tetragon
🔌 connect default/xwing /usr/bin/curl tcp 10.32.0.28:45200 -> 104.198.14.52:443
💥 exit    default/xwing /usr/bin/curl https://ebpf.io/applications/#tetragon SIGKILL
🚀 process default/xwing /bin/bash -c "curl -s -XPOST deathstar.default.svc.cluster.local/v1/request-landing"
🚀 process default/xwing /usr/bin/curl -s -XPOST deathstar.default.svc.cluster.local/v1/request-landing
The following extends the example from File Access Monitoring
with enforcement to ensure sensitive files are not read. The policy used is the
file_monitoring_enforce.yaml,
which you can review and extend as needed. The only difference between the
observation policy and the enforce policy is the addition of an action block
to SIGKILL the application and return an error on the operation.
To apply the policy:
kubectl delete -f https://raw.githubusercontent.com/cilium/tetragon/main/examples/quickstart/file_monitoring.yaml
kubectl apply -f https://raw.githubusercontent.com/cilium/tetragon/main/examples/quickstart/file_monitoring_enforce.yaml
kubectl delete -f https://raw.githubusercontent.com/cilium/tetragon/main/examples/quickstart/file_monitoring.yaml
kubectl apply -f https://raw.githubusercontent.com/cilium/tetragon/main/examples/quickstart/file_monitoring_enforce.yamlwget https://raw.githubusercontent.com/cilium/tetragon/main/examples/quickstart/file_monitoring_enforce.yaml
docker stop tetragon
docker run --name tetragon --rm --pull always \
--pid=host --cgroupns=host --privileged \
-v ${PWD}/file_monitoring_enforce.yaml:/etc/tetragon/tetragon.tp.d/file_monitoring_enforce.yaml \
-v /sys/kernel/btf/vmlinux:/var/lib/tetragon/btf \
quay.io/cilium/tetragon:v1.7.0With the policy applied, you can run tetra getevents to have Tetragon start
outputting events to the terminal.
kubectl exec -ti -n kube-system ds/tetragon -c tetragon -- tetra getevents -o compact --pods xwingPOD=$(kubectl -n kube-system get pods -l 'app.kubernetes.io/name=tetragon' -o name --field-selector spec.nodeName=$(kubectl get pod xwing -o jsonpath='{.spec.nodeName}'))
kubectl exec -ti -n kube-system $POD -c tetragon -- tetra getevents -o compact --pods xwingdocker exec -ti tetragon tetra getevents -o compactNext, attempt to read a sensitive file (one of the files included in the defined policy):
kubectl exec -ti xwing -- bash -c 'cat /etc/shadow'kubectl exec -ti xwing -- bash -c 'cat /etc/shadow'cat /etc/shadowBecause the file is included in the policy, the command will fail with an error code.
kubectl exec -ti xwing -- bash -c 'cat /etc/shadow'
The output should be similar to:
command terminated with exit code 137
This will generate a read event (Docker events will not contain the Kubernetes metadata shown here).
🚀 process default/xwing /bin/bash -c "cat /etc/shadow"
🚀 process default/xwing /bin/cat /etc/shadow
📚 read    default/xwing /bin/cat /etc/shadow
📚 read    default/xwing /bin/cat /etc/shadow
📚 read    default/xwing /bin/cat /etc/shadow
💥 exit    default/xwing /bin/cat /etc/shadow SIGKILL
Attempts to read or write to files that are not part of the enforced file policy are not impacted.
🚀 process default/xwing /bin/bash -c "echo foo >> bar; cat bar"
🚀 process default/xwing /bin/cat bar
💥 exit    default/xwing /bin/cat bar 0
💥 exit    default/xwing /bin/bash -c "echo foo >> bar; cat bar" 0
The completes the Getting Started guide. At this point you should be able to observe execution traces in a Kubernetes cluster and extend the base deployment of Tetragon with policies to observe and enforce different aspects of a Kubernetes system.
The rest of the docs provide further documentation about installation and using policies. Some useful links:
The recommended way to deploy Tetragon on a Kubernetes cluster is to use the Helm chart with Helm 3. Tetragon uses the helm.cilium.io repository to release the helm chart.
To install the latest release of the Tetragon helm chart, use the following command.
--set KEY1=VALUE1,KEY2=VALUE2.helm repo add cilium https://helm.cilium.io
helm repo update
helm install tetragon cilium/tetragon -n kube-system
To wait until Tetragon deployment is ready, use the following kubectl command:
kubectl rollout status -n kube-system ds/tetragon -w
You can then make modifications to the Tetragon configuration using helm upgrade, see the following example.
helm upgrade tetragon cilium/tetragon -n kube-system --set tetragon.grpc.address=localhost:1337
You can also edit the tetragon-config ConfigMap directly and restart the
Tetragon daemonset with:
kubectl edit cm tetragon-config -n kube-system
kubectl rollout restart ds/tetragon -n kube-system
The following Helm values configuration is required to install Tetragon on Talos Linux:
extraHostPathMounts:
- name: sys-kernel-tracing
mountPath: /sys/kernel/tracing
Upgrade Tetragon using a new specific version of the helm chart.
helm upgrade tetragon cilium/tetragon -n kube-system --version 0.9.0
Uninstall Tetragon using the following command.
helm uninstall tetragon -n kube-system
To run a stable version, please check Tetragon quay repository
and select which version you want. For example if you want to run the latest
version which is v1.7.0 currently.
docker run --name tetragon --rm -d \
--pid=host --cgroupns=host --privileged \
-v /sys/kernel/btf/vmlinux:/var/lib/tetragon/btf \
quay.io/cilium/tetragon:v1.7.0
To run unstable development versions of Tetragon, use the
latest tag from Tetragon-CI quay repository.
This will run the image that was built from the latest commit available on the
Tetragon main branch.
docker run --name tetragon --rm -d \
--pid=host --cgroupns=host --privileged \
-v /sys/kernel/btf/vmlinux:/var/lib/tetragon/btf \
quay.io/cilium/tetragon-ci:latest
There are multiple ways to set configuration options:
Append Tetragon controlling settings at the end of the command
As an example set the file where to export JSON events with --export-filename argument:
docker run --name tetragon --rm -d \
--pid=host --cgroupns=host --privileged \
-v /sys/kernel:/sys/kernel \
quay.io/cilium/tetragon:v1.7.0 \
/usr/bin/tetragon --export-filename /var/log/tetragon/tetragon.log
For a complete list of CLI arguments, please check Tetragon daemon configuration.
Environment variables
docker run --name tetragon --rm -d \
--pid=host --cgroupns=host --privileged \
--env "TETRAGON_EXPORT_FILENAME=/var/log/tetragon/tetragon.log" \
-v /sys/kernel:/sys/kernel \
quay.io/cilium/tetragon:v1.7.0
Every controlling setting can be set using environment variables. Prefix it with the key word TETRAGON_ then upper case the controlling setting. As an example to set where to export JSON events: --export-filename will be TETRAGON_EXPORT_FILENAME.
For a complete list of all controlling settings, please check tetragon daemon configuration.
Configuration files mounted as volumes
On the host machine set the configuration drop-ins inside /etc/tetragon/tetragon.conf.d/ directory according to the configuration examples, then mount it as volume:
docker run --name tetragon --rm -d \
--pid=host --cgroupns=host --privileged \
-v /sys/kernel:/sys/kernel \
-v /etc/tetragon/tetragon.conf.d/:/etc/tetragon/tetragon.conf.d/ \
quay.io/cilium/tetragon:v1.7.0
This will map the /etc/tetragon/tetragon.conf.d/ drop-in directory from the host into the container.
See Tetragon daemon configuration reference for further details.
Tetragon will be managed as a systemd service. Tarballs are built and distributed along the assets in the releases.
First download the latest binary tarball, using curl for example to download the amd64 release:
curl -LO https://github.com/cilium/tetragon/releases/download/v1.7.0/tetragon-v1.7.0-amd64.tar.gz
Extract the downloaded archive, and start the install script to install Tetragon. Feel free to inspect the script before starting it.
tar -xvf tetragon-v1.7.0-amd64.tar.gz
cd tetragon-v1.7.0-amd64/
sudo ./install.sh
If Tetragon was successfully installed, the final output should be similar to:
Tetragon installed successfully!
Finally, you can check the Tetragon systemd service.
sudo systemctl status tetragon
The output should be similar to:
● tetragon.service - Tetragon eBPF-based Security Observability and Runtime Enforcement
Loaded: loaded (/lib/systemd/system/tetragon.service; enabled; vendor preset: enabled)
Active: active (running) since Mon 2023-01-23 20:08:16 CET; 5s ago
Docs: https://github.com/cilium/tetragon/
Main PID: 138819 (tetragon)
Tasks: 17 (limit: 18985)
Memory: 151.7M
CPU: 913ms
CGroup: /system.slice/tetragon.service
└─138819 /usr/local/bin/tetragon
The default Tetragon configuration shipped with the Tetragon package will be
installed in /usr/local/lib/tetragon/tetragon.conf.d/. Local administrators
can change the configuration by adding drop-ins inside
/etc/tetragon/tetragon.conf.d/ to override the default settings or use the
command line flags. To restore default settings, remove any added configuration
inside /etc/tetragon/tetragon.conf.d/.
See Tetragon daemon configuration for further details.
To upgrade Tetragon:
Download the new tarball.
curl -LO https://github.com/cilium/tetragon/releases/download/v1.7.0/tetragon-v1.7.0-amd64.tar.gz
Stop the Tetragon service.
sudo systemctl stop tetragon
Remove the old Tetragon version.
sudo rm -fr /usr/lib/systemd/system/tetragon.service
sudo rm -fr /usr/local/bin/tetragon
sudo rm -fr /usr/local/lib/tetragon/
Install the upgraded Tetragon version.
tar -xvf tetragon-v1.7.0-amd64.tar.gz
cd tetragon-v1.7.0-amd64/
sudo ./install.sh
To completely remove Tetragon run the uninstall.sh script that is provided
inside the tarball.
sudo ./uninstall.sh
Or remove it manually.
sudo systemctl stop tetragon
sudo systemctl disable tetragon
sudo rm -fr /usr/lib/systemd/system/tetragon.service
sudo systemctl daemon-reload
sudo rm -fr /usr/local/bin/tetragon
sudo rm -fr /usr/local/bin/tetra
sudo rm -fr /usr/local/lib/tetragon/
To just purge custom settings:
sudo rm -fr /etc/tetragon/
unix:///var/run/tetragon/tetragon.sockTo access the gRPC API with tetra client, set --server-address to point to the corresponding address:
sudo tetra --server-address unix:///var/run/tetragon/tetragon.sock getevents
See restrict gRPC API access for further details.
By default JSON events are logged to /var/log/tetragon/tetragon.log unless this location is changed.
Logs are always rotated into the same directory.
To read real-time JSON events, tailing the logs file is enough.
sudo tail -f /var/log/tetragon/tetragon.log
Tetragon also ships a gRPC client that can be used to receive events.
To print events in json format using tetra gRPC client:
sudo tetra --server-address "unix:///var/run/tetragon/tetragon.sock" getevents
To print events in human compact format:
sudo tetra --server-address "unix:///var/run/tetragon/tetragon.sock" getevents -o compact
See Explore security observability events to learn more about how to see the Tetragon events.
See Tetragon Runtime Hooks, for an introduction to the topic.
We use minikube as the example platform because it supports both cri-o and containerd, but the
same steps can be applied to other platforms.
minikube start --driver=kvm2 --container-runtime=cri-o
minikube start --driver=kvm2 --container-runtime=containerd
Tetragon Runtime Hooks use NRI. NRI is enabled by default starting from containerd version 2.0. For version 1.7, however, it needs to be enabled in the configuration.
This requires a section such as:
[plugins."io.containerd.nri.v1.nri"]
disable = false
disable_connections = false
plugin_config_path = "/etc/nri/conf.d"
plugin_path = "/opt/nri/plugins"
plugin_registration_timeout = "5s"
plugin_request_timeout = "2s"
socket_path = "/var/run/nri/nri.sock"
To be present in containerd’s configuration (e.g., /etc/containerd/config.toml).
You can use the minikube-install-hook script to patch the configuration file:
./contrib/tetragon-rthooks/scripts/minikube-install-hook.sh --nri
This script updates the configuration and restarts containerd.
Note: Kind only supports containerd currently.
cat <<EOF > kind-config.yaml
apiVersion: kind.x-k8s.io/v1alpha4
kind: Cluster
nodes:
- role: control-plane
extraMounts:
- hostPath: /proc
containerPath: /procHost
EOF
kind create cluster --config kind-config.yaml
EXTRA_HELM_FLAGS=(--set tetragon.hostProcPath=/procHost) # flags for helm install
Tetragon Runtime Hooks use NRI. NRI is enabled by default starting from containerd version 2.0. For version 1.7, however, it needs to be enabled in the configuration.
You can check the containerd version using:
docker exec -it kind-control-plane crictl version
Output should be similar to:
Version: 0.1.0
RuntimeName: containerd
RuntimeVersion: v1.7.18
RuntimeApiVersion: v1
Assuming that the containerd version is earlier than 2.0,
you can use the kind-hook-setup.sh script to patch the configuration file:
./contrib/tetragon-rthooks/scripts/kind-hook-setup.sh
This script updates the configuration and restarts containerd.
helm repo add cilium https://helm.cilium.io
helm repo update
helm install \
--namespace kube-system \
--set rthooks.enabled=true \
--set rthooks.interface=oci-hooks \
${EXTRA_HELM_FLAGS[@]} \
tetragon cilium/tetragonhelm install \
--namespace kube-system \
--set rthooks.enabled=true \
--set rthooks.interface=nri-hook \
${EXTRA_HELM_FLAGS[@]} \
tetragon cilium/tetragonkubectl -n kube-system get pods | grep tetragon
With output similar to:
tetragon-hpjwq 2/2 Running 0 2m42s
tetragon-operator-664ddc8957-9lmd2 1/1 Running 0 2m42s
tetragon-rthooks-m24xr 1/1 Running 0 2m42s
Start a pod:
kubectl run test --image=debian --rm -it -- /bin/bash
Check logs:
minikube ssh 'tail -1 /opt/tetragon/tetragon-oci-hook.log'docker exec kind-control-plane sh -c 'tail -1 /opt/tetragon/tetragon-oci-hook.log'Output:
{"time":"2024-07-01T10:57:21.435689144Z","level":"INFO","msg":"hook request to agent succeeded","hook":"create-container","start-time":"2024-07-01T10:57:21.433755984Z","req-cgroups":"/kubepods/besteffort/podd4e74de2-0db8-4143-ae55-695b2489c727/crio-828977b42e3149b502b31708778d0c057efbce038af80d0882ed3e0cb0ff8796","req-rootdir":"/run/containers/storage/overlay-containers/828977b42e3149b502b31708778d0c057efbce038af80d0882ed3e0cb0ff8796/userdata","req-containerName":"test"}
installDir)For tetragon runtime hooks to work, a binary (tetragon-oci-hook) needs to be installed on the
host. Installation happens by the tetragon-rthooks daemonset and the binary is installed in
/opt/tetragon by default.
In some systems, however, the /opt directory is mounted read-only. This will result in
errors such as:
Warning FailedMount 8s (x5 over 15s) kubelet MountVolume.SetUp failed for volume "oci-hook-install-path" : mkdir /opt/tetragon: read-only file system (6 results) [48/6775]
You can use the rthooks.installDir helm variable to select a different location. For example:
--set rthooks.installDir=/run/tetragon
failAllowNamespaces and failAllowNamespacesRegex)By default, tetragon-oci-hook logs information to /opt/tetragon/tetragon-oci-hook.log.
Inspecting this file we get the following messages.
{"time":"2024-03-05T15:18:52.669044463Z","level":"WARN","msg":"hook request to the agent failed","hook":"create-container","start-time":"2024-03-05T15:18:42.667916779Z","req-cgroups":"/kubepods/besteffort/pod43ec7f32-3c9f-429f-a01c-fbaafff9f8e1/crio-1d18fd58f0879f6152a1c421f8f1e0987845394ee17001a16bee2df441c112f3","req-rootdir":"/run/containers/storage/overlay-containers/1d18fd58f0879f6152a1c421f8f1e0987845394ee17001a16bee2df441c112f3/userdata","err":"connecting to agent (context deadline exceeded) failed: unix:///var/run/tetragon/tetragon.sock"}
{"time":"2024-03-05T15:18:52.66912411Z","level":"INFO","msg":"failCheck determined that we should not fail this container, even if there was an error","hook":"create-container","start-time":"2024-03-05T15:18:42.667916779Z"}
{"time":"2024-03-05T15:18:53.01093915Z","level":"WARN","msg":"hook request to the agent failed","hook":"create-container","start-time":"2024-03-05T15:18:43.01005032Z","req-cgroups":"/kubepods/burstable/pod60f971e6-ac38-4aa0-b2d3-549333b2c803/crio-c0bf4e38bfa4ed5c58dd314d505f8b6a0f513d2f2de4dc4aa86a55c7c3e963ab","req-rootdir":"/run/containers/storage/overlay-containers/c0bf4e38bfa4ed5c58dd314d505f8b6a0f513d2f2de4dc4aa86a55c7c3e963ab/userdata","err":"connecting to agent (context deadline exceeded) failed: unix:///var/run/tetragon/tetragon.sock"}
{"time":"2024-03-05T15:18:53.010999098Z","level":"INFO","msg":"failCheck determined that we should not fail this container, even if there was an error","hook":"create-container","start-time":"2024-03-05T15:18:43.01005032Z"}
{"time":"2024-03-05T15:19:04.034580703Z","level":"WARN","msg":"hook request to the agent failed","hook":"create-container","start-time":"2024-03-05T15:18:54.033449685Z","req-cgroups":"/kubepods/besteffort/pod43ec7f32-3c9f-429f-a01c-fbaafff9f8e1/crio-d95e61f118557afdf3713362b9034231fee9bd7033fc8e7cc17d1efccac6f54f","req-rootdir":"/run/containers/storage/overlay-containers/d95e61f118557afdf3713362b9034231fee9bd7033fc8e7cc17d1efccac6f54f/userdata","err":"connecting to agent (context deadline exceeded) failed: unix:///var/run/tetragon/tetragon.sock"}
{"time":"2024-03-05T15:19:04.03463995Z","level":"INFO","msg":"failCheck determined that we should not fail this container, even if there was an error","hook":"create-container","start-time":"2024-03-05T15:18:54.033449685Z"}
To understand these messages, consider what tetragon-oci-hook should do if it
cannot contact the Tetragon agent.
You may want to stop certain workloads from running. For other workloads (for example, the
tetragon pod itself) you probably want to do the opposite and let them start. To this end,
tetragon-oci-hook checks the container annotations, and by default does not fail a container if it
belongs in the same namespace as Tetragon. The previous messages concern the tetragon containers
(tetragon-operator and tetragon) and they indicate that the choice was made not to fail this
container from starting.
Users can specify additional namespaces where a container will not fail if the Tetragon agent cannot be contacted. Two complementary options are available.
failAllowNamespaces)Use rthooks.failAllowNamespaces to provide a comma-separated list of exact namespace names.
rthooks:
enabled: true
failAllowNamespaces: namespace1,namespace2
failAllowNamespacesRegex)Use rthooks.failAllowNamespacesRegex to provide a list of RE2 regular expressions.
A container is allowed to start when its namespace matches any of the provided patterns.
Patterns perform substring matching by default; use ^ and $ anchors for full-string matching:
^kube-.*$ — prefix match (any namespace starting with kube-)^.*-system$ — suffix match (any namespace ending with -system)^foo-.*-bar$ — both prefix and suffix (any namespace starting with foo- and ending with -bar).* — matches any namespace (disables the hook for all namespaces)acme- also matches namespaces where acme- appears as a
substring, such as not-acme-foo. Use ^ and $ for precise matching.rthooks:
enabled: true
failAllowNamespacesRegex:
- "^acme-.*$"
- "^dev-.*$"
The two options can be combined. A container is allowed to start if its namespace matches either an exact name or any regex pattern:
rthooks:
enabled: true
failAllowNamespaces: kube-system
failAllowNamespacesRegex:
- "^acme-.*$"
- "^dev-.*$"
extraHookArgs sets fail-cel-expr, which always takes precedence.This guide presents various methods to install tetra in your environment.
This shell script autodetects the OS and the architecture, downloads the archive of the binary and its SHA 256 digest, compares that the actual digest with the supposed one, installs the binary, and removes the download artifacts.
curl(1), and the
sha256sum(1) utilities. For Go, see how to install the latest Go release
and for the curl and checksum utility, it is usually distributed in common
Linux distribution but you can usually find them respectively under the package
curl and coreutils.GOOS=$(go env GOOS)
GOARCH=$(go env GOARCH)
curl -L --remote-name-all https://github.com/cilium/tetragon/releases/latest/download/tetra-${GOOS}-${GOARCH}.tar.gz{,.sha256sum}
sha256sum --check tetra-${GOOS}-${GOARCH}.tar.gz.sha256sum
sudo tar -C /usr/local/bin -xzvf tetra-${GOOS}-${GOARCH}.tar.gz
rm tetra-${GOOS}-${GOARCH}.tar.gz{,.sha256sum}
This installation method retrieves the adapted archived for your environment,
extract it and install it in the /usr/local/bin directory.
curl(1) that should be already
installed in your environment, otherwise you can usually find it under the
curl package.curl -L https://github.com/cilium/tetragon/releases/latest/download/tetra-linux-amd64.tar.gz | tar -xz
sudo mv tetra /usr/local/bincurl -L https://github.com/cilium/tetragon/releases/latest/download/tetra-linux-arm64.tar.gz | tar -xz
sudo mv tetra /usr/local/bincurl -L https://github.com/cilium/tetragon/releases/latest/download/tetra-darwin-amd64.tar.gz | tar -xz
sudo mv tetra /usr/local/bincurl -L https://github.com/cilium/tetragon/releases/latest/download/tetra-darwin-arm64.tar.gz | tar -xz
sudo mv tetra /usr/local/bincurl -LO https://github.com/cilium/tetragon/releases/latest/download/tetra-windows-amd64.tar.gz
tar -xzf tetra-windows-amd64.tar.gz
# move the binary in a directory in your PATHcurl -LO https://github.com/cilium/tetragon/releases/latest/download/tetra-windows-arm64.tar.gz
tar -xzf tetra-windows-arm64.tar.gz
# move the binary in a directory in your PATHHomebrew is a package manager for macOS and Linux.
A formulae is available to
fetch precompiled binaries. You can also use it to build from sources (using the
--build-from-source flag) with a Go dependency.
brew install tetra
If the Tetragon agent runs the gRPC API over TLS or mTLS, point tetra at the
TCP listener and pass the matching credentials:
tetra \
--server-address tetragon.example.com:54321 \
--tls-ca-cert-files ca.crt \
--tls-cert-file client.crt \
--tls-key-file client.key \
getevents
See gRPC TLS / mTLS for the full flag list and provisioning options.
You can retrieve the release of tetra along the release of Tetragon on GitHub
at the following URL: https://github.com/cilium/tetragon/releases.
To download a specific release you can use the following script, replacing the
OS, ARCH and TAG values with your desired options.
OS=linux
ARCH=amd64
TAG=v0.9.0
curl -LO https://github.com/cilium/tetragon/releases/download/${TAG}/tetra-${OS}-${ARCH}.tar.gz | tar -xz
Learn how to verify Tetragon container images signatures.
You will need to install cosign.
Since version 0.8.4, all Tetragon container images are signed using cosign.
Let’s verify a Tetragon image’s signature using the cosign verify command:
cosign verify --certificate-github-workflow-repository cilium/tetragon --certificate-oidc-issuer https://token.actions.githubusercontent.com <Image URL> | jq
COSIGN_EXPERIMENTAL=1
environment variable to allow verification of images signed in KEYLESS mode.
To learn more about keyless signing, please refer to Sigstore documentation.Download and verify the signature of the software bill of materials
A Software Bill of Materials (SBOM) is a complete, formally structured list of components that are required to build a given piece of software. SBOM provides insight into the software supply chain and any potential concerns related to license compliance and security that might exist.
Starting with version 0.8.4, all Tetragon images include an SBOM. The SBOM is generated in SPDX format using the bom tool. If you are new to the concept of SBOM, see what an SBOM can do for you.
The SBOM can be downloaded from the supplied Tetragon image using the cosign download sbom command.
cosign download sbom --output-file sbom.spdx <Image URL>
To ensure the SBOM is tamper-proof, its signature can be verified using the
cosign verify command.
COSIGN_EXPERIMENTAL=1 cosign verify --certificate-github-workflow-repository cilium/tetragon --certificate-oidc-issuer https://token.actions.githubusercontent.com --attachment sbom <Image URL> | jq
It can be validated that the SBOM image was signed using Github Actions in the
Cilium repository from the Issuer and Subject fields of the output.
Depending on your deployment mode, Tetragon configuration can be changed by:
kubectl edit cm -n kube-system tetragon-config
# Change your configuration setting, save and exit
# Restart Tetragon daemonset
kubectl rollout restart -n kube-system ds/tetragon# Change configuration inside /etc/tetragon/ then restart container.
# Example:
# 1. As a privileged user, write to the file /etc/tetragon/tetragon.conf.d/export-file
# the path where to export events, example "/var/log/tetragon/tetragon.log"
# 2. Bind mount host /etc/tetragon into container /etc/tetragon
# Tetragon events will be exported to /var/log/tetragon/tetragon.log
echo "/var/log/tetragon/tetragon.log" > /etc/tetragon/tetragon.conf.d/export-file
docker run --name tetragon --rm -d \
--pid=host --cgroupns=host --privileged \
-v /etc/tetragon:/etc/tetragon \
-v /sys/kernel:/sys/kernel \
-v /var/log/tetragon:/var/log/tetragon \
quay.io/cilium/tetragon:v1.7.0 \
/usr/bin/tetragon# Change configuration inside /etc/tetragon/ then restart systemd service.
# Example:
# 1. As a privileged user, write to the file /etc/tetragon/tetragon.conf.d/export-file
# the path where to export events, example "/var/log/tetragon/tetragon.log"
# 2. Bind mount host /etc/tetragon into container /etc/tetragon
# Tetragon events will be exported to /var/log/tetragon/tetragon.log
echo "/var/log/tetragon/tetragon.log" > /etc/tetragon/tetragon.conf.d/export-file
systemctl restart tetragonTo read more about Tetragon configuration, please check our reference pages:
On Linux each process has various associated user, group IDs and capabilities
known as process credentials. To enable visility into process_credentials,
run Tetragon with enable-process-cred setting set.
kubectl edit cm -n kube-system tetragon-config
# Change "enable-process-cred" from "false" to "true", then save and exit
# Restart Tetragon daemonset
kubectl rollout restart -n kube-system ds/tetragonecho "true" > /etc/tetragon/tetragon.conf.d/enable-process-cred
docker run --name tetragon --rm -d \
--pid=host --cgroupns=host --privileged \
-v /etc/tetragon:/etc/tetragon \
-v /sys/kernel:/sys/kernel \
-v /var/log/tetragon:/var/log/tetragon \
quay.io/cilium/tetragon:v1.7.0 \
/usr/bin/tetragon# Write to the drop-in file /etc/tetragon/tetragon.conf.d/enable-process-cred true
# Run the following as a privileged user then restart tetragon service
echo "true" > /etc/tetragon/tetragon.conf.d/enable-process-cred
systemctl restart tetragonStarting with version 1.6.0, the Tetragon operator runs as a non-root user by default, enhancing the security posture of your Kubernetes deployments.
By default, the Tetragon operator runs with the following security context:
tetragonOperator:
containerSecurityContext:
runAsUser: 65532
runAsGroup: 65532
runAsNonRoot: true
allowPrivilegeEscalation: false
capabilities:
drop:
- "ALL"
To customize the security context, override the containerSecurityContext
values:
tetragonOperator:
containerSecurityContext:
runAsUser: 1001
runAsGroup: 1001
runAsNonRoot: true
allowPrivilegeEscalation: false
readOnlyRootFilesystem: true
capabilities:
drop:
- "ALL"
If you want to revert pre-1.6.0 version behavior for specific requirements and run the operator as root, use the following security context:
tetragonOperator:
containerSecurityContext:
runAsUser: 0
runAsGroup: 0
runAsNonRoot: false
allowPrivilegeEscalation: false
capabilities:
drop:
- "ALL"
Install Tetragon with a custom operator security context as defined above:
helm install tetragon cilium/tetragon \
--namespace kube-system \
--values custom-values.yaml
To verify the operator’s security context, run:
kubectl get pod -n kube-system -l app.kubernetes.io/name=tetragon-operator\
-o jsonpath='{.items[0].spec.containers[0].securityContext}' | jq
This will show the configured security context for the operator container.
Tetragon exposes a number of Prometheus metrics that can be used for two main purposes:
--enable-event-metrics=false flag.For the full list, refer to metrics reference.
In a Kubernetes installation, metrics are enabled by default and
exposed via the endpoint /metrics. The tetragon service exposes the Tetragon Agent metrics on port 2112, and the
tetragon-operator-metrics service the Tetragon Operator metrics on port 2113.
You can change the port via Helm values:
tetragon:
prometheus:
port: 2222 # default is 2112
tetragonOperator:
prometheus:
port: 3333 # default is 2113
Or entirely disable the metrics server:
tetragon:
prometheus:
enabled: false # default is true
tetragonOperator:
prometheus:
enabled: false # default is true
In a non-Kubernetes installation, metrics are disabled by default. You can enable them by setting the metrics server
address of the Tetragon Agent to, for example, :2112, via the --metrics-server flag.
If using systemd, set the metrics-address entry in a file under the
/etc/tetragon/tetragon.conf.d/ directory.
To verify that the metrics server has started, check the logs of the Tetragon components. Here’s an example for the Tetragon Agent, running on Kubernetes:
kubectl -n <tetragon-namespace> logs ds/tetragon
The logs should contain a line similar to the following:
time="2023-09-22T23:16:24+05:30" level=info msg="Starting metrics server" addr="localhost:2112"
To see what metrics are exposed, you can access the metrics endpoint directly. In Kubernetes, forward the metrics port:
kubectl -n <tetragon-namespace> port-forward svc/tetragon 2112:2112
Access localhost:2112/metrics endpoint either in a browser or for example using curl.
You should see a list of metrics similar to the following:
# HELP promhttp_metric_handler_errors_total Total number of internal errors encountered by the promhttp metric handler.
# TYPE promhttp_metric_handler_errors_total counter
promhttp_metric_handler_errors_total{cause="encoding"} 0
promhttp_metric_handler_errors_total{cause="gathering"} 0
# HELP tetragon_errors_total The total number of Tetragon errors. For internal use only.
# TYPE tetragon_errors_total counter
[...]
Depending on the workloads running in the environment, Events Metrics may have very high cardinality. This is particularly likely in Kubernetes environments, where each pod creates a separate timeseries. To avoid overwhelming Prometheus, Tetragon provides an option to choose which labels are populated in these metrics.
You can configure the labels via Helm values or the --metrics-label-filter flag. Set the value to a comma-separated
list of enabled labels:
tetragon:
prometheus:
metricsLabelFilter: "namespace,workload,binary" # "pod" label is disabled
Typically, metrics are scraped by Prometheus or another compatible agent (for example OpenTelemetry Collector), stored in Prometheus or another compatible database, then queried and visualized for example using Grafana.
In Kubernetes, you can install Prometheus and Grafana using the Kube-Prometheus-Stack Helm chart. This Helm chart includes the Prometheus Operator, which allows you to configure Prometheus via Kubernetes custom resources.
helm repo add prometheus-community https://prometheus-community.github.io/helm-charts
helm install kube-prometheus-stack prometheus-community/kube-prometheus-stack \
--namespace monitoring \
--create-namespace \
--set prometheus.prometheusSpec.serviceMonitorSelectorNilUsesHelmValues=false
By default, the Prometheus Operator only discovers PodMonitors and ServiceMonitors within its namespace, that are
labeled with the same release tag as the prometheus-operator release.
Hence, you need to configure Prometheus to also scrape data from Tetragon’s ServiceMonitor resources, which don’t
fulfill those conditions. This is configurable when installing the
Kube-Prometheus-Stack by setting the serviceMonitorSelectorNilUsesHelmValues flag.
Refer to the official Kube-Prometheus-Stack documentation for more details.
Tetragon comes with default ServiceMonitor resources containing the scrape confguration for the Agent and Operator.
You can enable it via Helm values:
tetragon:
prometheus:
serviceMonitor:
enabled: true
tetragonOperator:
prometheus:
serviceMonitor:
enabled: true
To ensure that Prometheus has detected the Tetragon metrics endpoints, you can check the Prometheus targets:
UP.Tetragon serves its gRPC API on two listeners:
/var/run/tetragon/tetragon.sock,
reserved for in-pod IPC and protected by file permissions.This page shows how to enable TLS, switch to mTLS, and connect with tetra.
--server-address points at a
unix:// socket. Configure a TCP address (for example 0.0.0.0:54321)
before enabling TLS.The chart can issue and rotate certificates for you. The default
auto.method=helm is the simplest option and requires no extra components.
helm upgrade --install tetragon cilium/tetragon -n kube-system \
--set tetragon.grpc.address=0.0.0.0:54321 \
--set tetragon.grpc.tls.enabled=true
The chart generates a CA and a server certificate with a wildcard SAN over
*.tetragon-grpc.cilium.io, and writes them to a Secret mounted at
/var/lib/tetragon/tls/ inside each agent pod. Clients must override SNI to
match this domain (see Connect with tetra).
mTLS makes the agent reject TCP connections that do not present a client certificate signed by the bundled CA.
helm upgrade --install tetragon cilium/tetragon -n kube-system \
--set tetragon.grpc.address=0.0.0.0:54321 \
--set tetragon.grpc.tls.enabled=true \
--set tetragon.grpc.tls.requireClientCert=true
You then mint client certificates from the same CA and pass them to tetra
or your own gRPC client.
Pick one method via tetragon.grpc.tls.auto.method:
| Method | When to use |
|---|---|
helm | Default. Helm renders the cert/key Secret directly. Rotation requires helm upgrade. |
cronJob | Periodic rotation by cilium-certgen. A bootstrap Job seeds the Secret on install; a CronJob refreshes it on auto.schedule. |
certmanager | Hand off issuance to cert-manager. Set auto.certManagerIssuerRef to your Issuer/ClusterIssuer. |
Tunables (tetragon.grpc.tls.*) are listed in the
Helm chart reference.
Disable auto-provisioning and point at an existing Secret:
helm upgrade --install tetragon cilium/tetragon -n kube-system \
--set tetragon.grpc.address=0.0.0.0:54321 \
--set tetragon.grpc.tls.enabled=true \
--set tetragon.grpc.tls.auto.enabled=false \
--set tetragon.grpc.tls.server.existingSecret=my-tetragon-grpc-tls
The Secret must contain:
tls.crt — PEM server certificatetls.key — matching PEM private keyca.crt — PEM CA bundle (required when requireClientCert=true)tetraPass the CA bundle and, for mTLS, the client cert and key. The auto-provisioned
server cert is wildcard, so override SNI to any hostname under
tetragon-grpc.cilium.io.
tetra \
--server-address tetragon.example.com:54321 \
--tls-ca-cert-files ca.crt \
--tls-cert-file client.crt \
--tls-key-file client.key \
--tls-server-name node.tetragon-grpc.cilium.io \
getevents
Drop --tls-cert-file / --tls-key-file if the server is in TLS-only mode.
If the server certificate chains to the host OS trust store, you can also omit
--tls-ca-cert-files; for example, --tls-server-name alone is enough to
switch tetra to a TLS connection that uses the system CA bundle.
--tls-skip-verify disables server certificate verification and is intended
for local development only. It is mutually exclusive with --tls-ca-cert-files.For container or systemd installs, set the daemon flags directly through drop-in configuration files:
echo "0.0.0.0:54321" > /etc/tetragon/tetragon.conf.d/server-address
echo "/etc/tetragon/tls/tls.crt" > /etc/tetragon/tetragon.conf.d/server-tls-cert-file
echo "/etc/tetragon/tls/tls.key" > /etc/tetragon/tetragon.conf.d/server-tls-key-file
# For mTLS, also set:
echo "true" > /etc/tetragon/tetragon.conf.d/server-tls-require-client-cert
echo "/etc/tetragon/tls/ca.crt" > /etc/tetragon/tetragon.conf.d/server-tls-client-ca-files
The full flag list is in the Daemon configuration reference.
The agent watches the parent directories of every TLS file with fsnotify
and reloads atomically when the contents change. No restart is required when
a Secret or mounted file is updated in place — the next handshake uses the
new material.
Tetragon needs Linux kernel version 4.19 or greater.
We currently run tests on stable long-term support kernels 4.19, 5.4, 5.10, 5.15 and bpf-next, see this test workflow for up to date information. Not all Tetragon features work with older kernel versions. BPF evolves rapidly and we recommend you use the most recent stable kernel possible to get the most out of Tetragon’s features.
Note that Tetragon needs BTF support which might take some work on older kernels.
Tetragon requires specific kernel configuration options to function properly. You can verify your kernel configuration and runtime capabilities using the following approaches.
tetra probe configAs a first step to verify your kernel configuration, you can use the
tetra probe config command. This will output a list of detected kernel
features relevant to Tetragon. Missing features can indicate that your kernel
is not configured correctly.
tetra probe config
The output should be similar to this:
ONFIG_AUDIT:y
CONFIG_AUDITSYSCALL:y
CONFIG_BPF:y
CONFIG_BPF_EVENTS:y
CONFIG_BPF_JIT:y
CONFIG_BPF_JIT_DEFAULT_ON:y
CONFIG_BPF_KPROBE_OVERRIDE:y
CONFIG_BPF_SYSCALL:y
CONFIG_CGROUPS:y
CONFIG_DEBUG_INFO_BTF:y
CONFIG_DEBUG_INFO_BTF_MODULES:y
CONFIG_FTRACE_SYSCALLS:y
CONFIG_HAVE_BPF_JIT:n
CONFIG_HAVE_EBPF_JIT:y
CONFIG_SECURITY:y
tetra probeTo probe if your kernel has sufficient features turned on at runtime, you can
run tetra probe, this command requires root privileges, notably to load probe
BPF programs:
sudo tetra probe
You can also run this command directly from the tetragon container image on a Kubernetes cluster node. For example:
kubectl run bpf-probe --image=quay.io/cilium/tetragon-ci:latest \
--privileged --restart=Never -it --rm --command -- tetra probe
The output should be similar to this (with boolean values depending on your actual configuration):
override_return: true
buildid: true
kprobe_multi: false
uprobe_multi false
fmodret: true
fmodret_syscall: true
signal: true
large: true
link_pin: true
lsm: false
missed_stats_kprobe_multi: false
missed_stats_kprobe: false
batch_update: true
uprobe_refctroff: true
audit_loginuid: true
probe_write_user: true
uprobe_regs_change: false
This is the list of needed configuration options, note that this might evolve quickly with new Tetragon features:
# CORE BPF
CONFIG_BPF
CONFIG_BPF_JIT
CONFIG_BPF_JIT_DEFAULT_ON
CONFIG_BPF_EVENTS
CONFIG_BPF_SYSCALL
CONFIG_HAVE_BPF_JIT
CONFIG_HAVE_EBPF_JIT
CONFIG_FTRACE_SYSCALLS
# BTF
CONFIG_DEBUG_INFO_BTF
CONFIG_DEBUG_INFO_BTF_MODULES
# Enforcement
CONFIG_BPF_KPROBE_OVERRIDE
# CGROUP and Process tracking
CONFIG_CGROUPS=y Control Group support
CONFIG_MEMCG=y Memory Control group
CONFIG_BLK_CGROUP=y Generic block IO controller
CONFIG_CGROUP_SCHED=y
CONFIG_CGROUP_PIDS=y Process Control group
CONFIG_CGROUP_FREEZER=y Freeze and unfreeze tasks controller
CONFIG_CPUSETS=y Manage CPUSETs
CONFIG_PROC_PID_CPUSET=y
CONFIG_CGROUP_DEVICE=Y Devices Control group
CONFIG_CGROUP_CPUACCT=y CPU accouting controller
CONFIG_CGROUP_PERF=y
CONFIG_CGROUP_BPF=y Attach eBPF programs to a cgroup
CGROUP_FAVOR_DYNMODS=y (optional) >= 6.0
Reduces the latencies of dynamic cgroup modifications at the
cost of making hot path operations such as forks and exits
more expensive.
Platforms with frequent cgroup migrations could enable this
option as a potential alleviation for pod and containers
association issues.
If the system is still on the old Cgroupv1 interface and the running kernel version is >= 6.11 then these kernel config options are required:
# CGROUPv1 Process tracking on kernels >= 6.11
CONFIG_MEMCG_V1=y
CONFIG_CPUSETS_V1=y
You might have encountered the following issues:
level=info msg="BTF discovery: default kernel btf file does not exist" btf-file=/sys/kernel/btf/vmlinux
level=info msg="BTF discovery: candidate btf file does not exist" btf-file=/var/lib/tetragon/metadata/vmlinux-5.15.49-linuxkit
level=info msg="BTF discovery: candidate btf file does not exist" btf-file=/var/lib/tetragon/btf
[...]
level=fatal msg="Failed to start tetragon" error="tetragon, aborting kernel autodiscovery failed: Kernel version \"5.15.49-linuxkit\" BTF search failed kernel is not included in supported list. Please check Tetragon requirements documentation, then use --btf option to specify BTF path and/or '--kernel' to specify kernel version"
Tetragon needs BTF (BPF Type Format) support to load its BPF programs using CO-RE (Compile Once - Run Everywhere). In brief, CO-RE is useful to load BPF programs that have been compiled on a different kernel version than the target kernel. Indeed, kernel structures change between versions and BPF programs need to access fields in them. So CO-RE uses the BTF file of the kernel in which you are loading the BPF program to know the differences between the struct and patch the fields offset in the accessed structures. CO-RE allows portability of the BPF programs but requires a kernel with BTF enabled.
Most of the common Linux distributions
now ship with BTF enabled and do not require any extra work, this is kernel
option CONFIG_DEBUG_INFO_BTF=y. To check if BTF is enabled on your Linux
system and see the BTF data file of your kernel, the standard location is
/sys/kernel/btf/vmlinux. By default, Tetragon will look for this file (this
is the first line in the log output above).
If your kernel does not support BTF you can:
CONFIG_DEBUG_INFO_BTF to y.Tetragon will also look into /var/lib/tetragon/btf for the vmlinux file
(this is the third line in the log output above). Or you can use the --btf
flag to directly indicate Tetragon where to locate the file.
If you encounter this issue while using Docker Desktop on macOS, please refer to can I run Tetragon on Mac computers.
Yes! Refer to the Container or Package installation guides.
Otherwise you can build Tetragon from source by running make to generate standalone
binaries.
Make sure to take a look at the Development Setup
guide for the build requirements. Then use sudo ./tetragon --bpf-lib bpf/objs
to run Tetragon.
Yes! You can run Tetragon locally by running a Linux virtual machine on your Mac.
On macOS running on amd64 (also known as Intel Mac) and arm64 (also know as Apple Silicon Mac), open source and commercial solutions exists to run virtual machines, here is a list of popular open source projects that you can use:
You can use these solutions to run a recent Linux distribution that ships with BTF debug information support.
Please note that you need to use a recent Docker Desktop version on macOS (for example 24.0.6
with Kernel 6.4.16-linuxkit), because the Linux
virtual machine provided by older Docker Desktop versions lacked support for the BTF debug information.
The BTF debug information file is needed for CO-RE
in order to load sensors of Tetragon. Run the following commands to see if Tetragon can be used on your Docker Desktop version:
# The Kernel needs to be compiled with CONFIG_DEBUG_INFO_BTF and
# CONFIG_DEBUG_INFO_BTF_MODULES support:
$ docker run -it --rm --privileged --pid=host ubuntu \
nsenter -t 1 -m -u -n -i sh -c \
'cat /proc/config.gz | gunzip | grep CONFIG_DEBUG_INFO_BTF'
CONFIG_DEBUG_INFO_BTF=y
CONFIG_DEBUG_INFO_BTF_MODULES=y
# "/sys/kernel/btf/vmlinux" should be present:
$ docker run -it --rm --privileged --pid=host ubuntu \
nsenter -t 1 -m -u -n -i sh -c 'ls -la /sys/kernel/btf/vmlinux'
-r--r--r-- 1 root root 4988627 Nov 21 20:33 /sys/kernel/btf/vmlinux
This error indicates that Linux Kernel Lockdown is preventing BPF programs from loading. Kernel Lockdown is a security feature designed to prevent even the root user from modifying the kernel or reading its internal secrets. It operates in two distinct modes:
/dev/mem or loading unsigned kernel modules.On systems with Kernel Lockdown enabled in confidentiality mode, Tetragon will fail with EPERM.
To fix this, use integrity mode.
You can verify the Lockdown status in the Tetragon startup logs.
A warning is printed when confidentiality mode is active:
level=warn msg="Kernel Lockdown is in 'confidentiality' mode; Tetragon will fail to load BPF programs. See https://tetragon.io/docs/installation/faq/#kernel-lockdown for details."
level=info msg="Tetragon current security context" SELinux=unconfined AppArmor=unconfined Smack="" Lockdown=confidentiality
You can also check the status of the Kernel Lockdown by running:
cat /sys/kernel/security/lockdown
Tetragon’s events are exposed to the system through either the gRPC endpoint or JSON logs. Commands in this section assume the Getting Started guide was used, but are general other than the namespaces chosen and should work in most environments.
The first way is to observe the raw json output from the stdout container log:
kubectl logs -n kube-system -l app.kubernetes.io/name=tetragon -c export-stdout -f
The raw JSON events provide Kubernetes API, identity metadata, and OS
level process visibility about the executed binary, its parent and the execution
time. A base Tetragon installation will produce process_exec and process_exit
events encoded in JSON as shown here,
{
"process_exec": {
"process": {
"exec_id": "Z2tlLWpvaG4tNjMyLWRlZmF1bHQtcG9vbC03MDQxY2FjMC05czk1OjEzNTQ4Njc0MzIxMzczOjUyNjk5",
"pid": 52699,
"uid": 0,
"cwd": "/",
"binary": "/usr/bin/curl",
"arguments": "https://ebpf.io/applications/#tetragon",
"flags": "execve rootcwd",
"start_time": "2023-10-06T22:03:57.700327580Z",
"auid": 4294967295,
"pod": {
"namespace": "default",
"name": "xwing",
"container": {
"id": "containerd://551e161c47d8ff0eb665438a7bcd5b4e3ef5a297282b40a92b7c77d6bd168eb3",
"name": "spaceship",
"image": {
"id": "docker.io/tgraf/netperf@sha256:8e86f744bfea165fd4ce68caa05abc96500f40130b857773186401926af7e9e6",
"name": "docker.io/tgraf/netperf:latest"
},
"start_time": "2023-10-06T21:52:41Z",
"pid": 49
},
"pod_labels": {
"app.kubernetes.io/name": "xwing",
"class": "xwing",
"org": "alliance"
},
"workload": "xwing"
},
"docker": "551e161c47d8ff0eb665438a7bcd5b4",
"parent_exec_id": "Z2tlLWpvaG4tNjMyLWRlZmF1bHQtcG9vbC03MDQxY2FjMC05czk1OjEzNTQ4NjcwODgzMjk5OjUyNjk5",
"tid": 52699
},
"parent": {
"exec_id": "Z2tlLWpvaG4tNjMyLWRlZmF1bHQtcG9vbC03MDQxY2FjMC05czk1OjEzNTQ4NjcwODgzMjk5OjUyNjk5",
"pid": 52699,
"uid": 0,
"cwd": "/",
"binary": "/bin/bash",
"arguments": "-c \"curl https://ebpf.io/applications/#tetragon\"",
"flags": "execve rootcwd clone",
"start_time": "2023-10-06T22:03:57.696889812Z",
"auid": 4294967295,
"pod": {
"namespace": "default",
"name": "xwing",
"container": {
"id": "containerd://551e161c47d8ff0eb665438a7bcd5b4e3ef5a297282b40a92b7c77d6bd168eb3",
"name": "spaceship",
"image": {
"id": "docker.io/tgraf/netperf@sha256:8e86f744bfea165fd4ce68caa05abc96500f40130b857773186401926af7e9e6",
"name": "docker.io/tgraf/netperf:latest"
},
"start_time": "2023-10-06T21:52:41Z",
"pid": 49
},
"pod_labels": {
"app.kubernetes.io/name": "xwing",
"class": "xwing",
"org": "alliance"
},
"workload": "xwing"
},
"docker": "551e161c47d8ff0eb665438a7bcd5b4",
"parent_exec_id": "Z2tlLWpvaG4tNjMyLWRlZmF1bHQtcG9vbC03MDQxY2FjMC05czk1OjEzNTQ4NjQ1MjQ1ODM5OjUyNjg5",
"tid": 52699
}
},
"node_name": "gke-john-632-default-pool-7041cac0-9s95",
"time": "2023-10-06T22:03:57.700326678Z"
}
We will only highlight a few important fields here. For a full specification of events see the Reference
section. All events in Tetragon contain a process_exec block to identify the process generating the
event. For execution events this is the primary block. For Tracing Policy events the
hook that generated the event will attach further data to this. The process_exec event provides
a cluster wide unique id the process_exec.exec_id for this process along with the metadata expected
in a Kubernetes cluster process_exec.process.pod. The binary and args being executed are part of
the event here process_exec.process.binary and process_exec.process.args. Finally, a node_name
and time provide the location and time for the event and will be present in all event types.
A default deployment writes the JSON log to /var/log/tetragon/tetragon.log where it can
be exported through normal log collection tooling, e.g. fluentd, logstash, etc. The file will
be rotated and compressed by default. See [Helm Options] for details on how to customize this location.
Export filters restrict the JSON event output to a subset of desirable events. These export filters are configured as a line-separated list of JSON objects, where each object can contain one or more filter expressions. Filters are combined by taking the logical OR of each line-separated filter object and the logical AND of sibling expressions within a filter object. As a concrete example, suppose we had the following filter configuration:
{"event_set": ["PROCESS_EXEC", "PROCESS_EXIT"], "namespace": ["foo"]}
{"event_set": ["PROCESS_KPROBE"]}
The above filter configuration would result in a match if:
PROCESS_EXEC or PROCESS_EXIT AND the pod namespace is “foo”; ORPROCESS_KPROBETetragon supports two groups of export filters: an allowlist and a denylist. If neither is configured, all events are exported. If only an allowlist is configured, event exports are considered default-deny, meaning only the events in the allowlist are exported. The denylist takes precedence over the allowlist in cases where two filter configurations match on the same event.
You can configure export filters using the provided helm options, command line flags, or environment variables.
denylist and allowlist filters mentioned above only apply to events
exported as JSON files (e.g., through a configured file sink). These filters
do not affect events streamed via the gRPC API, which are consumed by tools
like the tetra CLI. You will still see unfiltered events when using the
tetra CLI, even if those events would be filtered out by denylist or
allowlist for JSON export.The type for each filter attribute can be determined by referring to the events.proto file.
| Filter | Description |
|---|---|
event_set | Filter process events by event types. Supported types include: PROCESS_EXEC, PROCESS_EXIT, PROCESS_KPROBE, PROCESS_UPROBE, PROCESS_TRACEPOINT, PROCESS_LOADER |
binary_regex | Filter process events by a list of regular expressions of process binary names (e.g. "^/home/kubernetes/bin/kubelet$"). You can find the full syntax here. |
health_check | Filter process events if their binary names match Kubernetes liveness / readiness probe commands of their corresponding pods. |
namespace | Filter by Kubernetes pod namespaces. An empty string ("") filters processes that do not belong to any pod namespace. |
pid | Filter by process PID. |
pid_set | Like pid but also includes processes that are descendants of the listed PIDs. |
pod_regex | Filter by pod name using a list of regular expressions. You can find the full syntax here. |
arguments_regex | Filter by process arguments using a list of regular expressions. You can find the full syntax here. |
labels | Filter events by pod labels using Kubernetes label selector syntax Note that this filter never matches events without the pod field (i.e. host process events). |
policy_names | Filter events by tracing policy names. |
capabilities | Filter events by Linux process capability. |
cel_expression | Filter using CEL expressions. CEL filters support IP and CIDR notation extensions from the k8s project. See https://pkg.go.dev/k8s.io/apiserver/pkg/cel/library#IP and https://pkg.go.dev/k8s.io/apiserver/pkg/cel/library#CIDR for details. |
parent_binary_regex | Filter process events by a list of regular expressions of parent process binary names (e.g. "^/home/kubernetes/bin/kubelet$"). You can find the full syntax here. |
parent_arguments_regex | Filter by parent process arguments using a list of regular expressions. You can find the full syntax here. |
container_id | Filter by the container ID in the process.docker field using RE2 regular expression syntax: https://github.com/google/re2/wiki/Syntax |
in_init_tree | Filter containerized processes based on whether they are descendants of the container’s init process. This can be used, for example, to watch for processes injected into a container via docker exec, kubectl exec, or similar mechanisms. |
ancestor_binary_regex | Filter process events by a list of regular expressions of ancestor processes’ binary names (e.g. "^/home/kubernetes/bin/kubelet$"). You can find the full syntax here. |
In some cases, it is not desirable to include all of the fields exported in Tetragon events by default. In these cases, you can use field filters to restrict the set of exported fields for a given event type. Field filters are configured similarly to export filters, as line-separated lists of JSON objects.
Field filters select fields using the protobuf field mask syntax
under the "fields" key. You can define a path of fields using field
names separated by period (.) characters. To define multiple paths in
a single field filter, separate them with comma (,) characters. For
example, "fields":"process.binary,parent.binary,pod.name" would select
only the process.binary, parent.binary, and pod.name fields.
By default, a field filter applies to all process events, although you
can control this behaviour with the "event_set" key. For example, you
can apply a field filter to PROCESS_KPROBE and PROCESS_TRACEPOINT events
by specifying "event_set":["PROCESS_KPROBE","PROCESS_TRACEPOINT"] in the
filter definition.
Each field filter has an "action" that determines what the filter
should do with the selected field. The supported action types are
"INCLUDE" and "EXCLUDE". A value of "INCLUDE" will cause the field
to appear in an event, while a value of "EXCLUDE" will hide the field.
In the absence of any field filter for a given event type, the export
will include all fields by default. Defining one or more "INCLUDE"
filters for a given event type changes that behaviour to exclude all
other event types by default.
As a simple example of the above, consider the case where we want to include
only exec_id and parent_exec_id in all event types except for
PROCESS_EXEC:
{"fields":"process.exec_id,process.parent_exec_id", "event_set": ["PROCESS_EXEC"], "invert_event_set": true, "action": "INCLUDE"}
Since Tetragon traces the entire system, event exports might sometimes contain
sensitive information (for example, a secret passed via a command line argument
to a process). To prevent this information from being exfiltrated via Tetragon
JSON export, Tetragon provides a mechanism called Redaction Filters which can be
used to specify string patterns to redact from exported process arguments and environment
variables. These filters are written in JSON and passed to the Tetragon agent via
the --redaction-filters command line flag or the redactionFilters Helm value.
To perform redactions, redaction filters define RE2 regular expressions in the
redact field. Any capture groups in these RE2 regular expressions are redacted and
replaced with "*****".
\Wpasswd\W? would be written as {"redact": "\\Wpasswd\\W?"}.For more control, you can select which binary or binaries should have their
arguments or environment variables redacted with the binary_regex field.
As a concrete example, the following will redact all passwords passed to
processes with the "--password" argument:
{"redact": ["--password(?:\\s+|=)(\\S*)"]}
Now, an event that contains the string "--password=foo" would have that string
replaced with "--password=*****".
Suppose we also see some passwords passed via the -p shorthand for a specific binary, foo. We can also redact these as follows:
{"binary_regex": ["(?:^|/)foo$"], "redact": ["-p(?:\\s+|=)(\\S*)"]}
With both of the above redaction filters in place, we are now redacting all password arguments.
Another example is to redact SSHPASS environment variable with:
{"redact": ["(?:SSHPASS=)+(\\S+)"]}
Now, an event that contains the string "SSHPASS=password" would have that string
replaced with "SSHPASS=*****".
It’s also possible to store only requested environment variables with ‘–filter-environment-variables VAR1[,VAR2..]’ option.
tetra CLIA second way is to use the tetra CLI. This
has the advantage that it can also be used to filter and pretty print the output. The tool
allows filtering by process, pod, and other fields. To install tetra see the
Tetra Installation Guide
To start printing events run:
kubectl logs -n kube-system -l app.kubernetes.io/name=tetragon -c export-stdout -f | tetra getevents -o compact
The tetra CLI is also available inside tetragon container.
kubectl exec -it -n kube-system ds/tetragon -c tetragon -- tetra getevents -o compact
This was used in the quick start and generates a pretty printing of the events, To further filter by a specific binary and/or pod do the following,
kubectl logs -n kube-system -l app.kubernetes.io/name=tetragon -c export-stdout -f | tetra getevents -o compact --processes curl --pod xwing
This will filter and report just the relevant events.
🚀 process default/xwing /usr/bin/curl https://ebpf.io/applications/#tetragon
💥 exit default/xwing /usr/bin/curl https://ebpf.io/applications/#tetragon 60
In addition Tetragon can expose a gRPC endpoint listeners may attach to. The
gRPC is exposed by default helm install on unix:///var/run/tetragon/tetragon.sock,
but the address can be configured with the --server-address option. This can be
set from helm with the tetragon.grpc.address flag or disabled completely if
needed with tetragon.grpc.enabled.
helm install tetragon cilium/tetragon -n kube-system --set tetragon.grpc.enabled=true --set tetragon.grpc.address=localhost:54321
An example gRPC endpoint is the Tetra CLI when its not piped JSON output directly,
kubectl exec -ti -n kube-system ds/tetragon -c tetragon -- tetra getevents -o compact
Tetragon’s TracingPolicy is a user-configurable Kubernetes custom resource (CR) that
allows users to trace arbitrary events in the kernel and optionally define
actions to take on a match. Policies consist of a hook point (kprobes,
tracepoints, and uprobes are supported), and selectors for in-kernel filtering
and specifying actions. For more details, see
hook points page and the
selectors page.
For the complete custom resource definition (CRD) refer to Tracing Policy API documentation.
TracingPolicy allows for powerful, yet low-level configuration and, as such,
requires knowledge about the Linux kernel and containers to avoid unexpected
issues such as TOCTOU bugs.Tracing Policies can be loaded and unloaded at runtime in Tetragon, or on startup using flags.
kubectl to add and remove a TracingPolicy.tetra gRPC CLI to add and remove a TracingPolicy.--tracing-policy and --tracing-policy-dir flags to statically add policies at
startup time, see more in the daemon configuration page.Hence, even though Tracing Policies are structured as a Kubernetes CR, they can also be used in non-Kubernetes environments using the last two loading methods.
Note, however, that Tetragon stores policies per-domain. That means that each of the above methods is going to affect policies in its own domain. The domain sharding feature makes for consistent and predictable behavior across all methods.
k8s domaingrpc domainstatic domainYou can list currently loaded domains using
tetra tracingpolicy domains
It will produce out similar to:
[grpc static]
To discover TracingPolicy, let’s understand via an example that will be
explained, part by part, in this document:
apiVersion: cilium.io/v1alpha1
kind: TracingPolicy
metadata:
name: "fd-install"
spec:
kprobes:
- call: "fd_install"
syscall: false
args:
- index: 0
type: "int"
- index: 1
type: "file"
selectors:
- matchArgs:
- index: 1
operator: "Equal"
values:
- "/tmp/tetragon"
matchActions:
- action: Sigkill
The policy checks for file descriptors being created, and sends a SIGKILL signal to any process that
creates a file descriptor to a file named /tmp/tetragon. We discuss the policy in more detail
next.
apiVersion: cilium.io/v1alpha1
kind: TracingPolicy
metadata:
name: "fd-install"
The first part follows a common pattern among all Cilium Policies or more widely Kubernetes object. It first declares the Kubernetes API used, then the kind of Kubernetes object it is in this API and an arbitrary name for the object that has to comply with Kubernetes naming convention.
spec:
kprobes:
- call: "fd_install"
syscall: false
args:
- index: 0
type: "int"
- index: 1
type: "file"
The beginning of the specification describes the hook point to use. Here we are
using a kprobe, hooking on the kernel function fd_install. That’s the kernel
function that gets called when a new file descriptor is created. We
indicate that it’s not a syscall, but a regular kernel function. We then
specify the function arguments, so that Tetragon’s BPF code will extract
and optionally perform filtering on them.
See the hook points page for further information on the various hook points available and arguments.
selectors:
- matchArgs:
- index: 1
operator: "Equal"
values:
- "/tmp/tetragon"
matchActions:
- action: Sigkill
Selectors allow you to filter on the events to extract only a subset of the events based on different properties and optionally take an action.
In the example, we filter on the argument at index 1, passing a file struct
to the function. Tetragon has the knowledge on how to apply the Equal
operator over a Linux kernel file struct and match on the
path of the file.
Then we add the Sigkill action, meaning, that any match of the selector
should send a SIGKILL signal to the process that initiated the event.
Learn more about the various selectors in the dedicated selectors page.
The message field is an optional short message that will be included in
the generated event to inform users what is happening.
spec:
kprobes:
- call: "fd_install"
message: "Installing a file descriptor"
Tags are optional fields of a Tracing Policy that are used to categorize generated events. Further reference here: Tags documentation.
First, let’s create the /tmp/tetragon file with some content:
echo eBPF! > /tmp/tetragon
You can save the policy in an example.yaml file, compile Tetragon locally, and start Tetragon:
sudo ./tetragon --bpf-lib bpf/objs --tracing-policy example.yaml
(See Quick Kubernetes Install and Quick Local Docker Install for other ways to start Tetragon.)
Once the Tetragon starts, you can monitor events using tetra, the tetragon CLI:
./tetra getevents -o compact
Reading the /tmp/tetragon file with cat:
cat /tmp/tetragon
Results in the following events:
🚀 process /usr/bin/cat /tmp/tetragon
📬 open /usr/bin/cat /tmp/tetragon
💥 exit /usr/bin/cat /tmp/tetragon SIGKILL
And the shell where the cat command was performed will return:
Killed
For more examples of tracing policies, take a look at the examples/tracingpolicy folder in the Tetragon repository. Also read the following sections on hook points and selectors.
Each argument definition specifies data type to be retrieved from kernel argument. The list contains simple POD types and several complex kernel objects that are represented by extracted data type.
List of described data types:
sint8, int8uint8sint16, int16uint16int, sint32, int32uint32long, sint64, int64ulong, uint64, size_tstringskbsockchar_bufchar_iovecfilenamefdcredconst_bufnopbpf_attrperf_eventbpf_mapbpf_proguser_namespacecapabilitykiocbiov_iterload_infomodulesyscall64kernel_cap_tcap_inheritablecap_permittedcap_effectivelinux_binprmdata_locnet_devicesockaddrsockaddr_unsocketfiledentrypathint8, uint8, int16, uint16, int32, uint32, int64, uint64)
support Equal, NotEqual, GT, LT, and Mask operators in matchArgs or matchData.sint8, int8The data type extracts 8-bit signed value.
uint8The data type extracts 8-bit unsigned value.
sint16, int16The data type extracts 16-bit signed value.
uint16The data type extracts 16-bit unsigned value.
int, sint32, int32The data type extracts 32-bit signed value.
uint32The data type extracts 32-bit unsigned value.
long, sint64, int64The data type extracts 64-bit signed value.
ulong, uint64, size_tThe data type extracts 64-bit unsigned value.
stringThe data type extracts string terminated with zero byte.
In matchArgs or matchData, use Equal, NotEqual, Prefix, Postfix, SubString (v6.17+),
or SubStringIgnoreCase (v6.19+) operators.
skbThe skb data type represents kernel struct sk_buff (socket buffer) object.
It extracts network packet information including source/destination addresses,
ports, and protocol.
In matchArgs or matchData, use network operators: SAddr, DAddr,
SPort, DPort, Protocol, or their negated variants NotSAddr,
NotDAddr, NotSPort, NotDPort. Address values support CIDR notation.
sockThe sock data type represents kernel struct sock object, which is the
network layer representation of a socket. It extracts socket family, type,
state, and address information.
In matchArgs or matchData, use network operators: SAddr, DAddr,
SPort, DPort, Protocol, Family, or State.
char_bufThe char_buf data type represents a character buffer. When using this type,
specify the buffer size using sizeArgIndex (referencing another argument)
or returnCopy (using the return value).
In matchArgs or matchData, use Equal, NotEqual, Prefix, Postfix, SubString (v6.17+),
or SubStringIgnoreCase (v6.19+) operators.
char_iovecThe char_iovec data type represents an I/O vector (struct iovec) for
scatter/gather I/O operations. Use sizeArgIndex to specify the vector count.
In matchArgs or matchData, use Equal, NotEqual, Prefix, or Postfix operators.
filenameThe filename data type represents kernel struct filename object and
retrieves the user-provided filename string.
In matchArgs or matchData, use Equal, NotEqual, Prefix, Postfix, SubString (v6.17+),
or SubStringIgnoreCase (v6.19+) operators with path strings.
fdThe fd data type represents a file descriptor. Tetragon resolves the
file descriptor to retrieve the associated file path.
In matchArgs or matchData, use Equal, NotEqual, Prefix, Postfix, SubString (v6.17+),
or SubStringIgnoreCase (v6.19+) operators with path strings.
credThe cred data type represents kernel struct cred object containing
process credentials including UIDs, GIDs, and capabilities.
const_bufThe const_buf data type represents a buffer with a constant, statically
known size. Specify the buffer size using the size field.
nopThe nop data type instructs Tetragon to skip retrieval of the argument.
No data is extracted for this argument position.
bpf_attrThe bpf_attr data type represents the union bpf_attr structure used
in the bpf() syscall for BPF-related operations.
perf_eventThe perf_event data type represents kernel struct perf_event object
used for performance monitoring.
bpf_mapThe bpf_map data type represents kernel struct bpf_map object. It
extracts BPF map information including name, type, and key/value sizes.
bpf_progThe bpf_prog data type represents kernel struct bpf_prog object. It
extracts BPF program information including name and type.
user_namespaceThe user_namespace data type represents kernel struct user_namespace
object. It extracts the namespace identifier.
capabilityThe capability data type represents a Linux capability value being
checked or modified.
kiocbThe kiocb data type represents kernel struct kiocb (kernel I/O control
block) object. It retrieves the file path associated with the I/O operation.
In matchArgs or matchData, use Equal, NotEqual, Prefix, or Postfix operators
with path strings.
See general path limitations in path retrieval limits.
iov_iterThe iov_iter data type represents kernel struct iov_iter object, an
iterator for I/O operations over potentially multiple buffers.
load_infoThe load_info data type represents kernel struct load_info object
containing information about a kernel module being loaded.
moduleThe module data type represents kernel struct module object. It extracts
kernel module information including its name.
syscall64The syscall64 data type represents a syscall ID that distinguishes between
64-bit and 32-bit syscall ABIs. It outputs a SyscallId object containing
the syscall number and ABI (e.g., x64, i386). Commonly used with
raw_syscalls tracepoints and can be filtered with named syscalls using the
InMap operator.
kernel_cap_tThe kernel_cap_t data type represents a kernel capability bitmask holding
the complete set of Linux capabilities.
cap_inheritableThe cap_inheritable data type extracts the inheritable capability set
from a process’s credentials (struct cred).
cap_permittedThe cap_permitted data type extracts the permitted capability set
from a process’s credentials (struct cred).
cap_effectiveThe cap_effective data type extracts the effective capability set
from a process’s credentials (struct cred).
linux_binprmThe linux_binprm data type represents kernel struct linux_binprm object
and retrieves the struct linux_binprm::file full path.
In matchArgs or matchData, use Equal, NotEqual, Prefix, Postfix, SubString (v6.17+),
or SubStringIgnoreCase (v6.19+) operators with path strings.
See general path limitations in path retrieval limits.
data_locThe data_loc data type is used with tracepoints to extract dynamically
located string data using the kernel’s __data_loc mechanism.
In matchArgs or matchData, use Equal, NotEqual, Prefix, Postfix, SubString (v6.17+),
or SubStringIgnoreCase (v6.19+) operators.
net_deviceThe net_device data type represents kernel struct net_device object.
It extracts the network device name (e.g., eth0, lo).
In matchArgs or matchData, use Equal, NotEqual, Prefix, Postfix, SubString (v6.17+),
or SubStringIgnoreCase (v6.19+) operators with device name strings.
sockaddrThe sockaddr data type represents kernel struct sockaddr object. It
extracts socket address information including family, IP address, port,
or Unix socket path.
In matchArgs or matchData, use SAddr, SPort, or Family operators. Note that
sockaddr does not support destination operators (DAddr, DPort).
sockaddr_unThe sockaddr_un data type represents kernel struct sockaddr_un object
for Unix domain sockets. It extracts the socket family and path. Filesystem
paths are reported as-is; abstract socket names are reported with a leading @ character.
In matchArgs or matchData, use Equal, NotEqual, Prefix, NotPrefix,
or Family operators. Port, protocol, and state operators are not supported.
socketThe socket data type represents kernel struct socket object (BSD socket
layer), as opposed to struct sock (network layer).
In matchArgs or matchData, use network operators: SAddr, DAddr, SPort, DPort,
Protocol, Family, or State.
fileThe file data type represents kernel struct file object and retrieves
the file’s full path.
In matchArgs or matchData, use Equal, NotEqual, Prefix, Postfix, SubString (v6.17+),
or SubStringIgnoreCase (v6.19+) operators with path strings.
See general path limitations in path retrieval limits. Support for file type filtering is also available for this type.
dentryThe dentry data type represents kernel struct dentry object retrieves
the related path within one mountpoint.
This stems from the fact that with just struct dentry tetragon does not have
mount information and does not have enough data to pass through main point within
the path.
In matchArgs or matchData, use Equal, NotEqual, Prefix, Postfix, SubString (v6.17+),
or SubStringIgnoreCase (v6.19+) operators with path strings.
See general path limitations in path retrieval limits.
pathThe path data type represents kernel struct path object retrieves
the related path.
Support for file type filtering is also available for this type.
In matchArgs or matchData, use Equal, NotEqual, Prefix, Postfix, SubString (v6.17+),
or SubStringIgnoreCase (v6.19+) operators with path strings.
Full path retrieval is available only on kernels v5.3 and later.
On older kernels, there’s a limit of 256 path components, which means we can retrieve up to the maximum path length (4096 bytes), but only with 256 path entries (directories and file name).
Tetragon can hook into the kernel using kprobes and tracepoints, as well as in user-space
programs using uprobes. Users can configure these hook points using the correspodning sections of
the TracingPolicy specification (.spec). These hook points include arguments and return values
that can be specified using the args and returnArg fields as detailed in the following sections.
security_ hook, avoids this issue because it operates on kernel-resident
state after the data has been copied from user space.Kprobes enables you to dynamically hook into any kernel function and execute BPF code. Because kernel functions might change across versions, kprobes are highly tied to your kernel version and, thus, might not be portable across different kernels.
Conveniently, you can list all kernel symbols reading the /proc/kallsyms
file. For example to search for the write syscall kernel function, you can
execute sudo grep sys_write /proc/kallsyms, the output should be similar to
this, minus the architecture specific prefixes.
ffffdeb14ea712e0 T __arm64_sys_writev
ffffdeb14ea73010 T ksys_write
ffffdeb14ea73140 T __arm64_sys_write
ffffdeb14eb5a460 t proc_sys_write
ffffdeb15092a700 d _eil_addr___arm64_sys_writev
ffffdeb15092a740 d _eil_addr___arm64_sys_write
You can see that the exact name of the symbol for the write syscall on our
kernel version is __arm64_sys_write. Note that on x86_64, the prefix would
be __x64_ instead of __arm64_.
Kernel symbols contain an architecture specific prefix when they refer to syscall symbols. To write portable tracing policies, i.e. policies that can run on multiple architectures, just use the symbol name without the prefix.
For example, instead of writing call: "__arm64_sys_write" or call: "__x64_sys_write", just write call: "sys_write", Tetragon will adapt and add
the correct prefix based on the architecture of the underlying machine. Note
that the event generated as output currently includes the prefix.
In our example, we will explore a kprobe hooking into the
fd_install
kernel function. The fd_install kernel function is called each time a file
descriptor is installed into the file descriptor table of a process, typically
referenced within system calls like open or openat. Hooking fd_install
has its benefits and limitations, which are out of the scope of this guide.
spec:
kprobes:
- call: "fd_install"
syscall: false
syscall field, specific to a kprobe spec, with default value
false, that indicates whether Tetragon will hook a syscall or just a regular
kernel function. Tetragon needs this information because syscall and kernel
function use a different ABI.Kprobes calls can be defined independently in different policies, or together in the same Policy. For example, we can define trace multiple kprobes under the same tracing policy:
spec:
kprobes:
- call: "sys_read"
syscall: true
# [...]
- call: "sys_write"
syscall: true
# [...]
Tracepoints are statically defined in the kernel and have the advantage of being stable across kernel versions and thus more portable than kprobes.
To see the list of tracepoints available on your kernel, you can list them
using sudo ls /sys/kernel/tracing/events, the output should be similar
to this.
alarmtimer ext4 iommu page_pool sock
avc fib ipi pagemap spi
block fib6 irq percpu swiotlb
bpf_test_run filelock jbd2 power sync_trace
bpf_trace filemap kmem printk syscalls
bridge fs_dax kvm pwm task
btrfs ftrace libata qdisc tcp
cfg80211 gpio lock ras tegra_apb_dma
cgroup hda mctp raw_syscalls thermal
clk hda_controller mdio rcu thermal_power_allocator
cma hda_intel migrate regmap thermal_pressure
compaction header_event mmap regulator thp
cpuhp header_page mmap_lock rpm timer
cros_ec huge_memory mmc rpmh tlb
dev hwmon module rseq tls
devfreq i2c mptcp rtc udp
devlink i2c_slave napi sched vmscan
dma_fence initcall neigh scmi wbt
drm interconnect net scsi workqueue
emulation io_uring netlink signal writeback
enable iocost oom skb xdp
error_report iomap page_isolation smbus xhci-hcd
You can then choose the subsystem that you want to trace, and look the
tracepoint you want to use and its format. For example, if we choose the
netif_receive_skb tracepoints from the net subsystem, we can read its
format with sudo cat /sys/kernel/tracing/events/net/netif_receive_skb/format,
the output should be similar to the following.
name: netif_receive_skb
ID: 1398
format:
field:unsigned short common_type; offset:0; size:2; signed:0;
field:unsigned char common_flags; offset:2; size:1; signed:0;
field:unsigned char common_preempt_count; offset:3; size:1; signed:0;
field:int common_pid; offset:4; size:4; signed:1;
field:void * skbaddr; offset:8; size:8; signed:0;
field:unsigned int len; offset:16; size:4; signed:0;
field:__data_loc char[] name; offset:20; size:4; signed:0;
print fmt: "dev=%s skbaddr=%px len=%u", __get_str(name), REC->skbaddr, REC->len
Similarly to kprobes, tracepoints can also hook into system calls. For more
details, see the raw_syscalls and syscalls subysystems.
An example of tracepoints TracingPolicy could be the following, observing all
syscalls and getting the syscall ID from the argument at index 4:
apiVersion: cilium.io/v1alpha1
kind: TracingPolicy
metadata:
name: "raw-syscalls"
spec:
tracepoints:
- subsystem: "raw_syscalls"
event: "sys_enter"
args:
- index: 4
type: "int64"
Raw tracepoints allow same attachment as tracepoints, but allow access to raw tracepoint arguments (compared to standard tracepoints that provide access to arguments through tracepoint format).
Raw tracepoints are attach directly without the perf layer in the middle, so should be bit faster than standard tracepoints.
Each tracepoint is defined in kernel with similar statement like following:
TRACE_EVENT(sched_process_exec,
TP_PROTO(struct task_struct *p, pid_t old_pid,
struct linux_binprm *bprm),
...
);
which defines sched:sched_process_exec tracepoint with arguments.
Raw tracepoints are configured by setting with raw spec tag.
apiVersion: cilium.io/v1alpha1
kind: TracingPolicy
metadata:
name: "rawtp"
spec:
tracepoints:
- subsystem: "sched"
event: "sched_process_exec"
raw: true
We can use raw tracepoint to attach the tracepoint and access above arguments directly.
Following example stores 3rd argument:
apiVersion: cilium.io/v1alpha1
kind: TracingPolicy
metadata:
name: "rawtp"
spec:
tracepoints:
- subsystem: "sched"
event: "sched_process_exec"
raw: true
args:
- index: 2
type: "linux_binprm"
which is represented as path and permission data in the resulted event:
"subsys": "sched",
"event": "sched_process_exec",
"args": [
{
"linux_binprm_arg": {
"path": "/usr/bin/ls",
"permission": "rwxr-xr-x"
}
}
It’s also possible to resolve data from arguments with Resolve, like:
apiVersion: cilium.io/v1alpha1
kind: TracingPolicy
metadata:
name: "rawtp"
spec:
tracepoints:
- subsystem: "sched"
event: "sched_process_exec"
raw: true
args:
- index: 0
type: "int"
resolve: "pid"
- index: 2
type: "linux_binprm"
which gives you pid field from first task_struct argument, resulting in following event data:
"subsys": "sched",
"event": "sched_process_exec",
"args": [
{
"int_arg": 938600
},
{
"linux_binprm_arg": {
"path": "/usr/bin/ls",
"permission": "rwxr-xr-x"
}
}
Uprobes are similar to kprobes, but they allow you to dynamically hook into any user-space function and execute BPF code. Uprobes are also tied to the binary version of the user-space program, so they may not be portable across different versions or architectures.
To use uprobes, you need to specify the path to the executable or library file,
and the symbol of the function you want to probe. You can use tools like
objdump, nm, or readelf to find the symbol of a function in a binary
file. For example, to find the readline symbol in /bin/bash using nm, you
can run:
nm -D /bin/bash | grep readline
The output should look similar to this, with a few lines redacted:
[...]
000000000009f2b0 T pcomp_set_readline_variables
0000000000097e40 T posix_readline_initialize
00000000000d5690 T readline
00000000000d52f0 T readline_internal_char
00000000000d42d0 T readline_internal_setup
[...]
You can see in the nm output: first the symbol value, then the symbol type,
for the readline symbol T meaning that this symbol is in the text (code)
section of the binary, and finally the symbol name. This confirms that the
readline symbol is present in the /bin/bash binary and might be a function
name that we can hook with a uprobe.
You can define multiple uprobes in the same policy, or in different policies. You can also combine uprobes with kprobes and tracepoints to get a comprehensive view of the system behavior.
Here is an example of a policy that defines an uprobe for the readline function in the bash executable, and applies it to all processes that use the bash binary:
apiVersion: cilium.io/v1alpha1
kind: TracingPolicy
metadata:
name: "example-uprobe"
spec:
uprobes:
- path: "/bin/bash"
symbols:
- "readline"
This example shows how to use uprobes to hook into the readline function running in all the bash shells.
Uprobes support the full range of selectors available for filtering events,
including matchArgs, matchReturnArgs, matchBinaries, matchNamespaces,
matchCapabilities, and more. This allows you to precisely filter uprobe
events based on function arguments, return values, or process context.
Here is an example that only generates events when the readline function
is called from a specific binary and returns a string starting with “sudo”:
apiVersion: cilium.io/v1alpha1
kind: TracingPolicy
metadata:
name: "uprobe-with-selectors"
spec:
uprobes:
- path: "/bin/bash"
symbols:
- "readline"
return: true
returnArg:
index: 0
type: "string"
selectors:
- matchBinaries:
- operator: "In"
values:
- "/bin/bash"
- "/usr/bin/bash"
matchReturnArgs:
- index: 0
operator: "Prefix"
values:
- "sudo"
This policy will only generate events when readline is called from /bin/bash
and returns a string starting with “sudo”, which can be useful for monitoring potentially
sensitive command input.
For more details on available selectors and their usage, see the Selectors documentation.
In some cases, a uprobe policy is only intended to apply to a specific version of a binary, and could have adverse effect if attached to a different version of the binary.
For users that want to only apply the policy for a specific build, they can specify a digest type and value to validate the target binary. The following example policy demonstrates this functionality.
apiVersion: cilium.io/v1alpha1
kind: TracingPolicy
metadata:
name: "uprobe-digest-example"
spec:
uprobes:
- path: "/bin/example-target-binary"
symbols:
- "main"
ignore:
digestVerificationFailure: true
binaryDigests:
- "sha256:1111111111111111111111111111111111111111111111111111111111111111"
- "sha256:2222222222222222222222222222222222222222222222222222222222222222"
When the above policy is added, Tetragon calculates the sha256 hash of
/bin/example-target-binary and compares it against all configured binary
digests. If none of the configured digests match the binary’s calculated
digest, digest verification fails, and Tetragon will not attach to the
binary.
The ignore.digestVerificationFailure field controls how verification
failure is handled. If set to true, a hook that fails digest verification
is skipped and the policy is partially loaded. If not set, the policy is
rejected in its entirety (no hooks are attached).
If the policy is not rejected, Tetragon’s tracing policy status API
(TracingPolicyStatus) exposes each hook’s status. This way, users can
determine which uprobes/hooks were actually attached. In addition to
this hook status, the policy’s TracingPolicyState will be set to
TP_STATE_PARTIALLY_ENABLED when the policy is partially loaded.
As you can see from the above example, the format of the entries in the
binaryDigests list is <digest type>:<digest>.
The following digest types are supported:
.note.gnu.build-id)When a uprobe is attached, the kernel keeps track of the target by its inode. It’s best practice for installation software (such as rpm, deb, install, tar) to unlink a pre-existing target before installing a new version. This ensures that the new version of the binary will have a new inode, so the uprobe will not fire for it.
But, if the target binary is updated without an unlink, which would happen
if cp is used or if the target is opened and updated in-place, the inode
will be retained. In this case, the uprobe will continue firing for the
updated binary, potentially causing unintended effect. As such, it’s
critical that users of this feature ensure their installation method will
not retain the inode of the target binary that they want to update.
If the user wants the policy to apply to a new version of the binary post-installation, they need to reload the policy after installation in order to attach to the new version of the binary.
Tetragon allows to attach and monitor USDT (User Statically-Defined Tracing) probes.
You can display available USDT probes directly by checking ELF binary stapsdt notes with:
readelf -n ..../contrib/tester-progs/usdt
...
stapsdt 0x00000024 NT_STAPSDT (SystemTap probe descriptors)
Provider: test
Name: usdt0
Location: 0x000000000000115b, Base: 0x0000000000002004, Semaphore: 0x0000000000004030
Arguments:
stapsdt 0x00000043 NT_STAPSDT (SystemTap probe descriptors)
Provider: test
Name: usdt3
Location: 0x0000000000001177, Base: 0x0000000000002004, Semaphore: 0x0000000000004032
Arguments: -4@-12(%rbp) -8@-8(%rbp) 8@%rax
stapsdt 0x00000084 NT_STAPSDT (SystemTap probe descriptors)
Provider: test
Name: usdt12
Location: 0x000000000000120a, Base: 0x0000000000002004, Semaphore: 0x0000000000004034
Arguments: -4@-12(%rbp) -4@%edi -8@-8(%rbp) -8@%r8 -4@$5 -8@%r9 8@%rax 8@%r10 -4@$-9 -2@%dx -2@%cx -1@%sil
Or use tetra to generate tracing policy for available USDT probes with:
tetra tracingpolicy generate usdts --binary ..../contrib/tester-progs/usdt
that generates following tracing policy:
apiVersion: cilium.io/v1alpha1
kind: TracingPolicy
metadata:
creationTimestamp: "2025-07-28T21:23:36Z"
name: usdts
spec:
usdts:
- message: ""
name: usdt0
path: ./contrib/tester-progs/usdt
provider: test
- args:
- index: 0
label: -4@-12(%rbp)
maxData: false
resolve: ""
returnCopy: false
sizeArgIndex: 0
type: int32
- index: 1
label: -8@-8(%rbp)
maxData: false
resolve: ""
returnCopy: false
sizeArgIndex: 0
type: int64
- index: 2
label: 8@%rax
maxData: false
resolve: ""
returnCopy: false
sizeArgIndex: 0
type: uint64
Each USDT probe is defined with binary Path plus Provider and Name tags.
The combination of Provider and Name allows to group usdt probes and
is usually specific for each application.
Each probe can have up to 5 arguments (which is a tetragon limitation) that follow standard argument definitions used for other probes.
LSM BPF programs allow runtime instrumentation of the LSM hooks by privileged users to implement system-wide MAC (Mandatory Access Control) and Audit policies using eBPF.
List of LSM hooks which can be instrumented can be found in security/security.c.
To verify if BPF LSM is available use the following command:
cat /boot/config-$(uname -r) | grep BPF_LSM
The output should be similar to this if BPF LSM is supported:
CONFIG_BPF_LSM=y
Then, if provided above conditions are met, use this command to check if BPF LSM is enabled:
cat /sys/kernel/security/lsm
The output might look like this:
bpf,lockdown,integrity,apparmor
If the output includes the bpf, than BPF LSM is enabled. Otherwise, you can modify /etc/default/grub:
GRUB_CMDLINE_LINUX="lsm=lockdown,integrity,apparmor,bpf"
Then, update the grub configuration and restart the system.
The provided example of LSM BPF TracingPolicy monitors access to files
/etc/passwd and /etc/shadow with /usr/bin/cat executable.
apiVersion: cilium.io/v1alpha1
kind: TracingPolicy
metadata:
name: "lsm-file-open"
spec:
lsmhooks:
- hook: "file_open"
args:
- index: 0
type: "file"
selectors:
- matchBinaries:
- operator: "In"
values:
- "/usr/bin/cat"
matchArgs:
- index: 0
operator: "Equal"
values:
- "/etc/passwd"
- "/etc/shadow"
Kprobes, uprobes and tracepoints all share a needed arguments fields called args. It is a list of
arguments to include in the trace output. Tetragon’s BPF code requires
information about the types of arguments to properly read, print and
filter on its arguments. This information needs to be provided by the user under the
args section. For the available
types,
check the TracingPolicy
CRD.
Following our example, here is the part that defines the arguments:
args:
- index: 0
type: "int"
- index: 1
type: "file"
Each argument can optionally include a ’label’ parameter, which will be included in the output. This can be used to annotate the arguments to help with understanding and processing the output. As an example, here is the same definition, with an appropriate label on the int argument:
args:
- index: 0
type: "int"
label: "FD"
- index: 1
type: "file"
To properly read and hook onto the fd_install(unsigned int fd, struct file *file) function, the YAML snippet above tells the BPF code that the first
argument is an int and the second argument is a file, which is the
struct file
of the kernel. In this way, the BPF code and its printer can properly collect
and print the arguments.
These types are sorted by the index field, where you can specify the order.
The indexing starts with 0. So, index: 0 means, this is going to be the first
argument of the function, index: 1 means this is going to be the second
argument of the function, etc.
Note that for some args types, char_buf and char_iovec, there are
additional fields named returnCopy and sizeArgIndex available:
returnCopy indicates that the corresponding argument should be read later (when
the kretprobe for the symbol is triggered) because it might not be populated
when the kprobe is triggered at the entrance of the function. For example, a
buffer supplied to read(2) won’t have content until kretprobe is triggered.sizeArgIndex indicates the (1-based, see warning below) index of the arguments
that represents the size of the char_buf or iovec. For example, for
write(2), the third argument, size_t count is the number of char
element that we can read from the const void *buf pointer from the second
argument. Similarly, if we would like to capture the __x64_sys_writev(long, iovec *, vlen) syscall, then iovec has a size of vlen, which is going to
be the third argument.sizeArgIndex is inconsistent at the moment and does not take the index, but
the number of the index (or index + 1). So if the size is the third argument,
index 2, the value should be 3.These flags can be combined, see the example below.
- call: "sys_write"
syscall: true
args:
- index: 0
type: "int"
- index: 1
type: "char_buf"
returnCopy: true
sizeArgIndex: 3
- index: 2
type: "size_t"
Note that you can specify which arguments you would like to print from a
specific syscall. For example if you don’t care about the file descriptor,
which is the first int argument with index: 0 and just want the char_buf,
what is written, then you can leave this section out and just define:
args:
- index: 1
type: "char_buf"
returnCopy: true
sizeArgIndex: 3
- index: 2
type: "size_t"
This tells the printer to skip printing the int arg because it’s not useful.
For char_buf type up to the 4096 bytes are stored. Data with bigger size are
cut and returned as truncated bytes.
You can specify maxData flag for char_buf type to read maximum possible data
(currently 327360 bytes), like:
args:
- index: 1
type: "char_buf"
maxData: true
sizeArgIndex: 3
- index: 2
type: "size_t"
This field is only used for char_buff data. When this value is false (default),
the bpf program will fetch at most 4096 bytes. In later kernels (>=5.4) tetragon
supports fetching up to 327360 bytes if this flag is turned on.
The maxData flag does not work with returnCopy flag at the moment, so it’s
usable only for syscalls/functions that do not require return probe to read the
data.
This functionality allows you to dynamically extract specific attributes from
kernel structures passed as parameters to Kprobes and LSM hooks.
For example, when using the bprm_check_security LSM hook, you can access and
display attributes from the parameter struct linux_binprm *bprm at index 0.
This parameter contains many informations you may want to access.
With the resolve flag, you can easily access fields such as
mm.owner.real_parent.comm, which provides the parent process comm.
The following tracing policy demonstrates how to use the resolve flag to extract the parent process’s comm during the execution of a binary:
apiVersion: cilium.io/v1alpha1
kind: TracingPolicy
metadata:
name: "lsm"
spec:
lsmhooks:
- hook: "bprm_check_security"
args:
- index: 0 # struct linux_binprm *bprm
type: "string"
resolve: "mm.owner.real_parent.comm"
selectors:
- matchActions:
- action: Post
index flag : The parameter at index 0 is a pointer to the
struct linux_binprm.resolve flag : Using the resolve flag, the policy extracts the
mm.owner.real_parent.comm field, representing the parent process’s comm.struct linux_binprm, take a look at its definition in
include/linux/binfmts.hTetragon can also handle some structures such as struct file or struct path and a few others. This means you can also extract the whole struct, if it is
available in the attributes of the parameter, and set the type with the correct type
like this :
...
lsmhooks:
- hook: "bprm_check_security"
args:
- index: 0 # struct linux_binprm *bprm
type: "file"
resolve: "file"
...
Or
...
lsmhooks:
- hook: "bprm_check_security"
args:
- index: 0
type: "path"
resolve: "file.f_path"
...
The following tracing policy demonstrates how to use the resolve flag on nested
pointers. For exemple, the hook security_inode_copy_up (defined in
security/security.c)
takes two parameters: struct dentry *src and struct cred **new. The resolve
flag allows you to access fields within these nested structures transparently.
apiVersion: cilium.io/v1alpha1
kind: TracingPolicy
metadata:
name: "lsm"
spec:
kprobes:
- call: "security_inode_copy_up"
syscall: false
args:
- index: 0 # struct dentry *src
type: "int64"
- index: 1 # struct cred **new
type: "int"
resolve: "user.uid.val"
selectors:
- matchActions:
- action: Post
It is also possible to resolve arrays (int arr[100]) and dynamic arrays
(int **dyn_arr) by using square bracket notations, similarly as follows:
- index: 0
resolve: some.field[12].some.subfield
type: uint32
By default, Tetragon starts resolve from the BTF type of the hook argument.
For kprobes, tracepoints, and LSM hooks, this type comes from the kernel BTF
prototype. For uprobes and USDT probes, it comes from the BTF file configured
with btfPath.
Use btfType when the hook argument type is too generic, or when you need to
cast the argument to a more specific structure before resolving fields. The
btfType value is the BTF struct name without the struct prefix.
The following example resolves fields from the struct sockaddr_in view of the
second security_socket_connect argument:
apiVersion: cilium.io/v1alpha1
kind: TracingPolicy
metadata:
name: "socket-connect-address"
spec:
kprobes:
- call: "security_socket_connect"
syscall: false
args:
- index: 1
type: "uint16"
label: "sockaddr_in.sin_port"
btfType: "sockaddr_in"
resolve: "sin_port"
- index: 1
type: "uint32"
label: "sockaddr_in.sin_addr.s_addr"
btfType: "sockaddr_in"
resolve: "sin_addr.s_addr"
For kprobe arguments, use btfTypeModule with btfType when the structure is
defined by a kernel module instead of the main kernel BTF. The module name
should be the kernel module name, without a .ko suffix.
apiVersion: cilium.io/v1alpha1
kind: TracingPolicy
metadata:
name: "af-alg-bind"
spec:
kprobes:
- call: "security_socket_bind"
syscall: false
args:
- index: 1
type: "uint16"
label: "sockaddr_alg.salg_family"
btfType: "sockaddr_alg_new"
btfTypeModule: "af_alg"
resolve: "salg_family"
- index: 1
type: "string"
label: "sockaddr_alg.salg_name"
btfType: "sockaddr_alg_new"
btfTypeModule: "af_alg"
resolve: "salg_name"
btfTypeModule is set, Tetragon first tries to read module BTF exposed by
the kernel in /sys/kernel/btf/<module>. If that is not available, Tetragon
fails to load the policy.If btfTypeModule is omitted, Tetragon searches the main kernel BTF first. For
hooks that belong to a loaded module, Tetragon also tries that hook’s module BTF.
Kprobes allow definition of data fields and following matchData selector
that allows to retrieve data from kernel current task object and specify
filter on it.
Following example defines data field that retrieves comm field from
kernel current_task object.
data:
- index: 0
type: "string"
source: "current_task"
resolve: "comm"
selectors:
- matchData:
- index: 0
operator: "Equal"
values:
- "example"
Note all data field spec definitions need to define source (ATM only available value
is current_task) and resolve string based on kernel struct task_struct object.
A TracingPolicy spec can specify that the return value should be reported in
the tracing output. To do this, the return parameter of the call needs to be
set to true, and the returnArg parameter needs to be set to specify the
type of the return argument. For example:
- call: "sk_alloc"
syscall: false
return: true
args:
- index: 1
type: int
label: "family"
returnArg:
index: 0
type: sock
In this case, the sk_alloc hook is specified to return a value of type sock
(a pointer to a struct sock). Whenever the sk_alloc hook is hit, not only
will it report the family parameter in index 1, it will also report the socket
that was created.
A unique feature of a sock being returned from a hook such as sk_alloc is that
the socket it refers to can be tracked. Most networking hooks in the network stack
are run in a context that is not that of the process that owns the socket for which
the actions relate; this is because networking happens asynchronously and not
entirely in-line with the process. The sk_alloc hook does, however, occur in the
context of the process, such that the task, the PID, and the TGID are of the process
that requested that the socket was created.
Specifying socket tracking tells Tetragon to store a mapping between the socket
and the process’ PID and TGID; and to use that mapping when it sees the socket in a
sock argument in another hook to replace the PID and TGID of the context with the
process that actually owns the socket. This can be done by adding a returnArgAction
to the call. Use returnArg to include the return value in the event output;
returnArgAction is only for the socket-tracking actions TrackSock and
UntrackSock.
See TrackSock and UntrackSock.
- call: "sk_alloc"
syscall: false
return: true
args:
- index: 1
type: int
label: "family"
returnArg:
index: 0
type: sock
returnArgAction: TrackSock
Socket tracking has the following limitations:
Kernel version: socket tracking is only available on kernels >=5.3.
LRU map overflow: socket mappings are stored in an LRU (Least Recently Used) hash map in the kernel with a fixed upper limit for entries. When the map is full, old entries are evicted to make space for new ones. If many sockets are created in a short period, older socket mappings may be lost and network events may be attributed to the wrong process.
Socket sharing between processes: sockets are not strictly owned by a single
process—they can be shared via fork() (when both parent and child keep the
file descriptor open) or via IPC file descriptor passing. Tetragon attributes
all socket activity to the process that originally created the socket. If that
process exits while another continues using the socket, the mapping references
a process that no longer exists.
It’s possible to define list of functions and use it in the kprobe’s call field.
Following example traces all sys_dup[23] syscalls.
spec:
lists:
- name: "dups"
type: "syscalls"
values:
- "sys_dup"
- "sys_dup2"
- "sys_dup3"
kprobes:
- call: "list:dups"
It is basically a shortcut for following policy:
spec:
kprobes:
- call: "sys_dup"
syscall: true
- call: "sys_dup2"
syscall: true
- call: "sys_dup3"
syscall: true
As shown in subsequent examples, its main benefit is allowing a single definition for calls that have the same filters.
The list is defined under lists field with arbitrary values for name and values fields.
spec:
lists:
- name: "dups"
type: "syscalls"
values:
- "sys_dup"
- "sys_dup2"
- "sys_dup3"
...
It’s possible to define multiple lists.
spec:
lists:
- name: "dups"
type: "syscalls"
values:
- "sys_dup"
- "sys_dup2"
- "sys_dup3"
name: "another"
- "sys_open"
- "sys_close"
Syscalls specified with sys_ prefix are translated to their 64 bit equivalent function names.
It’s possible to specify a syscall for an alternative ABI by using the ABI name as a prefix. For example:
spec:
lists:
- name: "dups"
type: "syscalls"
values:
- "sys_dup"
- "i386/sys_dup"
name: "another"
- "sys_open"
- "sys_close"
Specific list can be referenced in kprobe’s call field with "list:NAME" value.
spec:
lists:
- name: "dups"
...
kprobes:
- call: "list:dups"
The kprobe definition creates a kprobe for each item in the list and shares the rest of the config specified for kprobe.
List can also specify type field that implies extra checks on the values (like for syscall type)
or denote that the list is generated automatically (see below).
User must specify syscall type for list with syscall functions. Also syscall functions
can’t be mixed with regular functions in the list.
The additional selector configuration is shared with all functions in the list. In following example we create 3 kprobes that share the same pid filter.
spec:
lists:
- name: "dups"
type: "syscalls"
values:
- "sys_dup"
- "sys_dup2"
- "sys_dup3"
kprobes:
- call: "list:dups"
selectors:
- matchPIDs:
- operator: In
followForks: true
isNamespacePID: false
values:
- 12345
It’s possible to use argument filter together with the list.
It’s important to understand that the argument will be retrieved by using the specified argument type for all the functions in the list.
Following example adds argument filter for first argument on all functions in dups list to match value 9999.
spec:
lists:
- name: "dups"
type: "syscalls"
values:
- "sys_dup"
- "sys_dup2"
- "sys_dup3"
kprobes:
- call: "list:dups"
args:
- index: 0
type: int
selectors:
- matchArgs:
- index: 0
operator: "Equal"
values:
- 9999
There are two additional special types of generated lists.
The generated_syscalls type of list that generates list with all possible
syscalls on the system.
Following example traces all syscalls for /usr/bin/kill binary.
spec:
lists:
- name: "all-syscalls"
type: "generated_syscalls"
kprobes:
- call: "list:all-syscalls"
selectors:
- matchBinaries:
- operator: "In"
values:
- "/usr/bin/kill"
The generated_ftrace type of list that generates functions from ftrace available_filter_functions
file with specified filter. The filter is specified with pattern field and expects regular expression.
Following example traces all kernel ksys_* functions for /usr/bin/kill binary.
spec:
lists:
- name: "ksys"
type: "generated_ftrace"
pattern: "^ksys_*"
kprobes:
- call: "list:ksys"
selectors:
- matchBinaries:
- operator: "In"
values:
- "/usr/bin/kill"
Note that if syscall list is used in selector with InMap operator, the argument type needs to be syscall64, like.
spec:
lists:
- name: "dups"
type: "syscalls"
values:
- "sys_dup"
- "i386/sys_dup"
tracepoints:
- subsystem: "raw_syscalls"
event: "sys_enter"
args:
- index: 4
type: "syscall64"
selectors:
- matchArgs:
- index: 0
operator: "InMap"
values:
- "list:dups"
It’s possible to define selectors macros in TracingPolicy specification that
contain selectors definitions, which can be used in kprobes, tracepoints,
uprobes, usdts, and lsmhooks as a part of their selectors by macro name.
The content of the macro will be substituted in target selectors.
Consider we have tracing policy, where we want to intercept kernel functions
call_1, call_2, call_3, but target binary must not be located in
directory dir. For that we define the following policy:
spec:
kprobes:
- call: <call_1>
selectors:
- matchBinaries:
- operator: "NotPrefix"
values:
- "dir"
- call: <call_2>
selectors:
- matchBinaries:
- operator: "NotPrefix"
values:
- "dir"
- call: <call_3>
selectors:
- matchBinaries:
- operator: "NotPrefix"
values:
- "dir"
With macros, we can rewrite this policy in more convenient way:
spec:
selectorsMacros:
dir:
matchBinaries:
- operator: "NotPrefix"
values:
- "dir"
kprobes:
- call: <call_1>
selectors:
- macros: [ dir ]
- call: <call_2>
selectors:
- macros: [ dir ]
- call: <call_3>
selectors:
- macros: [ dir ]
For a more realistic example, consider we want to intercept system calls open
and openat, which have different signatures: open system call has
pathname as a first argument, and openat has pathname as a second
argument. We want to catch event when pathname ends with passwd, but we
want to filter out events where binary has prefix /opt/myapp, because we
consider that our application can read passwd file safely. Because these
system calls signatures are different, we cannot create a list and have same
matchArgs selector, because indices of pathname are different.
With macros, the policy would look like this:
spec:
selectorsMacros:
myappExclusion:
matchBinaries:
- operator: "NotPrefix"
values: "/opt/myapp"
kprobes:
- call: "sys_open"
args:
- index: 0
type: "string"
selectors:
- matchArgs:
- index: 0
operator: "Postfix"
values:
- "passwd"
macros: ["myappExclusion"]
- call: "sys_openat"
args:
- index: 1
type: "string"
selectors:
- matchArgs:
- index: 1
operator: "Postfix"
values:
- "passwd"
macros: ["myappExclusion"]
Having a same field in a hook selector and in a macro definition, or using different macros with same fields defined will result in an error.
The following policy will be considered as incorrect, because there is
matchArgs field in both macro and policy selector:
spec:
selectorsMacros:
argMacro:
matchArgs:
- index: 0
operator: "NotEqual"
values:
- <value-1>
kprobes:
- call: <call>
args:
- index: 0
type: int
selectors:
- macros: [ argMacro ]
matchArgs:
- index: 0
operator: "NotEqual"
values:
- <value-1>
The following policy will be considered as incorrect, because different
macros contain matchArgs field and used in same selector:
spec:
selectorsMacros:
argMacro1:
matchArgs:
- index: 0
operator: "NotEqual"
values:
- <value-1>
argMacro2:
matchArgs:
- index: 0
operator: "NotEqual"
values:
- <value-2>
kprobes:
- call: <call>
args:
- index: 0
type: int
selectors:
- macros: [ argMacro1, argMacro2 ]
It’s possible to pass options through spec file as an array of name and value pairs:
spec:
options:
- name: "option-1"
value: "True"
- name: "option-2"
value: "10"
Options array is passed and processed by each hook used in the spec file that supports options. At the moment it’s availabe for kprobe and uprobe hooks.
Kprobe Options: options for kprobe hooks.Uprobe Options: options for uprobe hooks.disable-kprobe-multi: disable kprobe multi linkThis option disables kprobe multi link interface for all the kprobes defined in the spec file. If enabled, all the defined kprobes will be atached through standard kprobe interface. It stays enabled for another spec file without this option.
It takes boolean as value, by default it’s false.
Example:
options:
- name: "disable-kprobe-multi"
value: "1"
disable-uprobe-multi: disable uprobe multi linkThis option disables uprobe multi link interface for all the uprobes defined in the spec file. If enabled, all the defined uprobes will be atached through standard uprobe interface. It stays enabled for another spec file without this option.
It takes boolean as value, by default it’s false.
Example:
options:
- name: "disable-uprobe-multi"
value: "1"
Selectors enable per-hook in-kernel BPF filtering and actions. Each selector defines a set of
filters as well as a set of (optional) actions to be performed if the selector filters match. Each
hook can contain up to 5 selectors. If no selectors are defined on a hook, the default action
(Post, i.e., post an event) will be used.
Each selector comprises a set of filters:
matchArgs: filter on the value of arguments.matchData: filter on the value of data fields.matchReturnArgs: filter on the return value.matchPIDs: filter on PID.matchBinaries: filter on binary path.matchParentBinaries: filter on parent binary path.matchNamespaces: filter on Linux namespaces.matchCapabilities: filter on Linux capabilities.matchNamespaceChanges: filter on Linux namespaces changes.matchCapabilityChanges: filter on Linux capabilities changes.matchWorkloads: filter on Kubernetes workloads.And a set of actions that will be performed if the specified filters match:
matchActions: apply an action on selector matching.matchReturnActions: apply an action on return selector matching.For a selector to match, all of its filters must match (AND operator). If a selector defines no
filters, it matches. If multiple selectors are defined in a hook, only the action defined in the
first matching selector will be applied (short-circuited OR). If a selector defines no action, the
default action (Post) is applied.
For example, the following policy will generate events when the sys_mount system call is executed
by binaries other than /usr/bin/mount.
apiVersion: cilium.io/v1alpha1
kind: TracingPolicy
metadata:
name: "mount-example"
spec:
kprobes:
- call: "sys_mount"
syscall: true
selectors:
# first selector
- matchBinaries:
- operator: In
values:
- "/usr/bin/mount"
matchActions:
- action: NoPost
# second selector
- matchActions:
- action: Post
Arguments filters can be specified under the matchArgs field and provide
filtering based on the value of the function’s argument.
You can specify the argument either in the index or in args field. The index field
denotes the argument position within the function arguments, while the args
field denotes the arguments position within the spec arguments. Both fields are
zero based (1st argument has zero value). The args field (if defined) takes
precedence over index field.
The args field can support multiple arguments. Currently, the only operator that supports more
than 1 argument is the CapabilitiesGained operator.
In the next example, a selector is defined with a matchArgs filter that tells
the BPF code to process only the function call for which the second argument,
index equal to 1, concerns the file under the path /etc/passwd or
/etc/shadow. It’s using the operator Equal to match against the value of
the argument.
Note that conveniently, we can match against a path directly when the argument
is of type file.
selectors:
- matchArgs:
- index: 1
operator: "Equal"
values:
- "/etc/passwd"
- "/etc/shadow"
In the next example, a selector is defined with a matchArgs filter that tells
the BPF code to process only the function call for which the second spec argument,
args equals to [1] (which represents 1st function argument, index equals to 0),
has value 0xcoffee.
- args:
- index: 2
type: "int"
label: "arg0-index2"
- index: 0
type: "int"
label: "arg1-index1"
- index: 1
type: "int"
label: "arg2-index0"
selectors:
- matchArgs:
- args: [1]
operator: "Equal"
values:
- "0xcoffee"
Note that you can mix index and arg fields within matchArgs selector definitions.
The available operators for matchArgs are:
EqualNotEqualPrefixPostfixMaskFileTypeNotFileTypeCelExprFurther examples
In the previous example, we used the operator Equal, but we can also use the
Prefix operator and match against all files under /etc with:
selectors:
- matchArgs:
- index: 1
operator: "Prefix"
values:
- "/etc"
In this situation, an event will be created every time a process tries to
access a file under /etc.
Although it makes less sense, you can also match over the first argument, to only detect events that will use the file descriptor 4, which is usually the first that come afters stdin, stdout and stderr in process. And combine that with the previous example.
- matchArgs:
- index: 0
operator: "Equal"
values:
- "3"
- index: 1
operator: "Prefix"
values:
- "/etc"
The FileType and NotFileType operators allow filtering based on the type of a
file (e.g., regular file, pipe, socket, etc.). These operators can only be used
with arguments of type file or path.
Matching file types:
sock or socket: Socketlnk or link: Symbolic linkreg or regular: Regular fileblk or block: Block devicedir: Directorychr or char: Character devicefifo or pipe: FIFO/PipeIn the following example, we monitor vfs_write only for regular files.
selectors:
- matchArgs:
- index: 0
operator: "FileType"
values:
- "reg"
The CelExpr argument filter allows specifying filtering expressions in
CEL that are evaluated in-kernel.
Here’s a policy example:
apiVersion: cilium.io/v1alpha1
kind: TracingPolicy
metadata:
name: "sys-lseek-cel-example"
spec:
kprobes:
- call: "sys_lseek"
syscall: true
args:
- index: 2
type: "int"
label: "whence"
- index: 0
type: "int"
label: "fd"
- index: 1
type: "long"
label: "offset"
selectors:
- matchArgs:
- operator: "CelExpr"
values:
- "arg1 == int32(-1) && arg0 >= int32(1024)"
Arguments, as specified in the args: list, are made available in the CEL expression as argX
where X is the zero-based index in the list. In the above example, the argument labeled whence
is available as arg0, while the argument labeled fd is available as arg1.
Currently, CelExpr operators support:
+) and subtraction (-)&&), OR (||), and NOT (!) operators==, !=, <, <=, >, >=)int32(), uint32())Data filters can be specified under the matchData field and provide
filtering based on the value of the specified data field.
The data block allows you to filter events based on fields of
kernel data structures rather than function arguments — for example,
the UID of the current task at a hook that does not take credentials
as an argument. Each entry in the data block specifies:
source: where to read from. Supported values are current_task
(the process’s task_struct) and pt_regs (the register state at
the hook point).resolve: which field of the source structure to read.type: how the resolved value should be interpreted.A matchData selector then refers to a data entry by its index
and applies an operator.
In the following example we extract the pid value from current_task
and filter on all values except for 1.
data:
- index: 0
type: "int"
source: "current_task"
resolve: "pid"
selectors:
- matchData:
- index: 0
operator: "NotEqual"
values:
- "1"
Nested fields can be accessed through the . separator, as described
in Attribute resolution.
In the following example we extract the UID of the current task via
cred.uid.val and filter for non-system users (UID greater than
1000), hooked at security_bprm_committed_creds — an LSM hook
called after a process’s credentials are committed.
kprobes:
- call: "security_bprm_committed_creds"
syscall: false
data:
- index: 0
type: "int"
source: "current_task"
resolve: "cred.uid.val"
selectors:
- matchData:
- index: 0
operator: "GreaterThan"
values:
- "1000"
The same pattern works for non-integer types. The following example
reads the process name from comm (a string field of task_struct)
and matches when it equals a specific value.
data:
- index: 0
type: "string"
source: "current_task"
resolve: "comm"
selectors:
- matchData:
- index: 0
operator: "Equal"
values:
- "cat"
The available operators for matchData are the same as those listed under
Arguments filter, and apply according to the type
declared in the corresponding data entry.
Arguments filters can be specified under the returnMatchArgs field and
provide filtering based on the value of the function return value. It allows
you to filter on the return value, thus success, error or value returned by a
kernel call.
matchReturnArgs:
- operator: "NotEqual"
values:
- 0
The available operators for matchReturnArgs are:
EqualNotEqualPrefixPostfixA use case for this would be to detect the failed access to certain files, like
/etc/shadow. Doing cat /etc/shadow will use a openat syscall that will
returns -1 for a failed attempt with an unprivileged user.
PIDs filters can be specified under the matchPIDs field and provide filtering
based on the value of host pid of the process. For example, the following
matchPIDs filter tells the BPF code that observe only hooks for which the
host PID is equal to either pid1 or pid2 or pid3:
- matchPIDs:
- operator: "In"
followForks: true
values:
- "pid1"
- "pid2"
- "pid3"
The available operators for matchPIDs are:
InNotInFurther examples
Another example can be to collect all processes not associated with a
container’s init PID, which is equal to 1. In this way, we are able to detect
if there was a kubectl exec performed inside a container because processes
created by kubectl exec are not children of PID 1.
- matchPIDs:
- operator: NotIn
followForks: false
isNamespacePID: true
values:
- 1
Binary filters can be specified under the matchBinaries field and provide
filtering based on the value of a certain binary name. For example, the
following matchBinaries selector tells the BPF code to process only system
calls and kernel functions that are coming from cat or tail.
- matchBinaries:
- operator: "In"
values:
- "/usr/bin/cat"
- "/usr/bin/tail"
The available operators for matchBinaries are:
InNotInPrefixNotPrefixPostfixNotPostfixThe values field has to be a map of strings.
The matchBinaries filter can be configured to also apply to children of matching processes. To do
this, set followChildren to true. For example:
- matchBinaries:
- operator: "In"
values:
- "/usr/sbin/sshd"
followChildren: true
There are a number of limitations when using followChildren:
matchBinaries sections with followChildren: true cannot exceed 64.operator can be In or NotIn.Further examples
One example can be to monitor all the sys_write system calls which are
coming from the /usr/sbin/sshd binary and its child processes and writing to
stdin/stdout/stderr.
This is how we can monitor what was written to the console by different users
during different ssh sessions. The matchBinaries selector in this case is the
following:
- matchBinaries:
- operator: "In"
values:
- "/usr/sbin/sshd"
followChildren: true
while the whole kprobe call is the following:
- call: "sys_write"
syscall: true
args:
- index: 0
type: "int"
- index: 1
type: "char_buf"
sizeArgIndex: 3
- index: 2
type: "size_t"
selectors:
# match to /sbin/sshd
- matchBinaries:
- operator: "In"
values:
- "/usr/sbin/sshd"
followChildren: true
# match to stdin/stdout/stderr
matchArgs:
- index: 0
operator: "Equal"
values:
- "1"
- "2"
- "3"
matchBinaries matches against the interpreter, not the script path.When executing a script with a shebang (i.e. #!/usr/bin/python3), Linux actually runs the
interpreter and passes the script as an argument. Current implementation of matchBinaries filters based on the interpreter path (i.e. /usr/bin/python3) and not the script name (i.e. /opt/scripts/my_script.py).
This won’t work:
- matchBinaries:
- operator: "In"
values:
- "/opt/scripts/my_script.py"
Match the interpreter instead:
- matchBinaries:
- operator: "In"
values:
- "/usr/bin/python3"
matchParentBinaries selector can be used only with BPF map parents_map enabled (option --parents-map-enabled), which adds
additional memory overhead.Parent binaries filter provides filtering based on current process parent
binary path, which works similarly to the matchBinaries filter. It can be
specified with the matchParentBinaries field. For instance, the following
matchParentBinaries selector will match only if binary cat was executed
from interactive shell like zsh, bash, sh:
- matchParentBinaries:
- operator: "In"
values:
- "/usr/bin/bash"
- "/usr/bin/sh"
- "/usr/bin/zsh"
matchBinaries:
- operator: "In"
values:
- "/usr/bin/cat"
The available operators for matchParentBinaries are:
InNotInPrefixNotPrefixPostfixNotPostfixThe values field has to be a map of strings.
The matchParentBinaries filter can be configured to also apply to children of
matching parent processes. To do this, set followChildren to true. For example:
- matchParentBinaries:
- operator: "In"
values:
- "/usr/bin/bash"
followChildren: true
This policy will match any process, which direct or transitive parent process binary is bash.
There are a number of limitations when using followChildren:
matchParentBinaries sections with followChildren: true cannot exceed 64.In/NotIn are not supported.Namespaces filters can be specified under the matchNamespaces field and
provide filtering of calls based on Linux namespace. You can specify the
namespace inode or use the special host_ns keyword, see the example and
description for more information.
An example syntax is:
- matchNamespaces:
- namespace: Pid
operator: In
values:
- "4026531836"
- "4026531835"
This will match if: [Pid namespace is 4026531836] OR [Pid namespace is
4026531835]
namespace can be: Uts, Ipc, Mnt, Pid, PidForChildren, Net,
Cgroup, or User. Time and TimeForChildren are also available in Linux
>= 5.6.operator can be In or NotInvalues can be raw numeric values (i.e. obtained from lsns) or "host_ns"
which will automatically be translated to the appropriate value.Limitations
values. These can be both numeric and host_ns inside
a single namespace.namespace values under matchNamespaces in Linux
kernel < 5.3. In Linux >= 5.3 we can have up to 10 values (i.e. the maximum
number of namespaces that modern kernels provide).Further examples
We can have multiple namespace filters:
selectors:
- matchNamespaces:
- namespace: Pid
operator: In
values:
- "4026531836"
- "4026531835"
- namespace: Mnt
operator: In
values:
- "4026531833"
- "4026531834"
This will match if: ([Pid namespace is 4026531836] OR [Pid namespace is
4026531835]) AND ([Mnt namespace is 4026531833] OR [Mnt namespace
is 4026531834])
Use cases examples
Generate a kprobe event if
/etc/shadowwas opened by/bin/catwhich either had hostNetorMntnamespace access
apiVersion: cilium.io/v1alpha1
kind: TracingPolicy
metadata:
name: "example_ns_1"
spec:
kprobes:
- call: "fd_install"
syscall: false
args:
- index: 0
type: int
- index: 1
type: "file"
selectors:
- matchBinaries:
- operator: "In"
values:
- "/bin/cat"
matchArgs:
- index: 1
operator: "Equal"
values:
- "/etc/shadow"
matchNamespaces:
- namespace: Mnt
operator: In
values:
- "host_ns"
- matchBinaries:
- operator: "In"
values:
- "/bin/cat"
matchArgs:
- index: 1
operator: "Equal"
values:
- "/etc/shadow"
matchNamespaces:
- namespace: Net
operator: In
values:
- "host_ns"
This example has 2 selectors. Note that each selector starts with -.
Selector 1:
- matchBinaries:
- operator: "In"
values:
- "/bin/cat"
matchArgs:
- index: 1
operator: "Equal"
values:
- "/etc/shadow"
matchNamespaces:
- namespace: Mnt
operator: In
values:
- "host_ns"
Selector 2:
- matchBinaries:
- operator: "In"
values:
- "/bin/cat"
matchArgs:
- index: 1
operator: "Equal"
values:
- "/etc/shadow"
matchNamespaces:
- namespace: Net
operator: In
values:
- "host_ns"
We have [Selector1 OR Selector2]. Inside each selector we have filters.
Both selectors have 3 filters (i.e. matchBinaries, matchArgs, and
matchNamespaces) with different arguments. Adding a - in the beginning of a
filter will result in a new selector.
So the previous CRD will match if:
[binary == /bin/cat AND arg1 == /etc/shadow AND MntNs == host] OR
[binary == /bin/cat AND arg1 == /etc/shadow AND NetNs is host]
We can modify the previous example as follows:
Generate a kprobe event if
/etc/shadowwas opened by/bin/catwhich has hostNetandMntnamespace access
apiVersion: cilium.io/v1alpha1
kind: TracingPolicy
metadata:
name: "example_ns_2"
spec:
kprobes:
- call: "fd_install"
syscall: false
args:
- index: 0
type: int
- index: 1
type: "file"
selectors:
- matchBinaries:
- operator: "In"
values:
- "/bin/cat"
matchArgs:
- index: 1
operator: "Equal"
values:
- "/etc/shadow"
matchNamespaces:
- namespace: Mnt
operator: In
values:
- "host_ns"
- namespace: Net
operator: In
values:
- "host_ns"
Here we have a single selector. This CRD will match if:
[binary == /bin/cat AND arg1 == /etc/shadow AND (MntNs == host AND
NetNs == host) ]
Capabilities filters can be specified under the matchCapabilities field and
provide filtering of calls based on Linux capabilities in the specific sets.
An example syntax is:
- matchCapabilities:
- type: Effective
operator: In
values:
- "CAP_CHOWN"
- "CAP_NET_RAW"
This will match if: [Effective capabilities contain CAP_CHOWN] OR
[Effective capabilities contain CAP_NET_RAW]
type can be: Effective, Inheritable, or Permitted.operator can be In or NotInvalues can be any supported capability. A list of all supported
capabilities can be found in /usr/include/linux/capability.h.Limitations
values.type field can be specified under matchCapabilities.Namespace changes filter can be specified under the matchNamespaceChanges
field and provide filtering based on calls that are changing Linux namespaces.
This filter can be useful to track execution of code in a new namespace or even
container escapes that change their namespaces.
For instance, if an unprivileged process creates a new user namespace, it gains full privileges within that namespace. This grants the process the ability to perform some privileged operations within the context of this new namespace that would otherwise only be available to privileged root user. As a result, such filter is useful to track namespace creation, which can be abused by untrusted processes.
To keep track of the changes, when a process_exec happens, the namespaces of
the process are recorded and these are compared with the current namespaces on
the event with a matchNamespaceChanges filter.
matchNamespaceChanges:
- operator: In
values:
- "Mnt"
The unshare command, or executing in the host namespace using nsenter can
be used to test this feature.
Capability changes filter can be specified under the matchCapabilityChanges
field and provide filtering based on calls that are changing Linux capabilities.
To keep track of the changes, when a process_exec happens, the capabilities
of the process are recorded and these are compared with the current
capabilities on the event with a matchCapabilityChanges filter.
matchCapabilityChanges:
- type: Effective
operator: In
isNamespaceCapability: false
values:
- "CAP_SETUID"
See a demonstration example of this feature.
Workloads filter can be specified under the matchWorkloads field and provides
filtering based on Kubernetes workloads. Inside matchWorkloads the user can
define a hostSelector, a podSelector, and a containerSelector.
This works in a similar way to global workload selectors such as spec.hostSelector,
spec.podSelector, and spec.containerSelector. More details on these
can be found in Filtering semantics.
Loading a tracing policy with matchWorkloads outside of Kubernetes will fail
in a similar way to global workload selectors.
The following match host workloads and pods inside kube-system namespace:
matchWorkloads:
hostSelector: {}
podSelector:
matchExpressions:
- key: "k8s:io.kubernetes.pod.namespace"
operator: In
values:
- "kube-system"
Actions filters are a list of actions that execute when an appropriate selector
matches. They are defined under matchActions and currently, the following
action types are supported:
Sigkill, Override, Post,
TrackSock and UntrackSock are
executed directly in the kernel BPF code while GetUrl and DnsLookup are
happening in userspace after the reception of events.Sigkill action terminates synchronously the process that made the call that
matches the appropriate selectors from the kernel. In the example below, every
sys_write system call with a PID not equal to 1 or 0 attempting to write to
/etc/passwd will be terminated. Indeed when using kubectl exec, a new
process is spawned in the container PID namespace and is not a child of PID 1.
- call: "sys_write"
syscall: true
args:
- index: 0
type: "fd"
- index: 1
type: "char_buf"
sizeArgIndex: 3
- index: 2
type: "size_t"
selectors:
- matchPIDs:
- operator: NotIn
followForks: true
isNamespacePID: true
values:
- 0
- 1
matchArgs:
- index: 0
operator: "Prefix"
values:
- "/etc/passwd"
matchActions:
- action: Sigkill
Signal action sends specified signal to current process. The signal number
is specified with argSig value.
Following example is equivalent to the Sigkill action example above.
The difference is to use the signal action with SIGKILL(9) signal.
- call: "sys_write"
syscall: true
args:
- index: 0
type: "fd"
- index: 1
type: "char_buf"
sizeArgIndex: 3
- index: 2
type: "size_t"
selectors:
- matchPIDs:
- operator: NotIn
followForks: true
isNamespacePID: true
values:
- 0
- 1
matchArgs:
- index: 0
operator: "Prefix"
values:
- "/etc/passwd"
matchActions:
- action: Signal
argSig: 9
Override action is defined for kprobe, uprobe and lsmhooks selectors, each one of them supporting different arguments:
| Hook | Arguments |
|---|---|
| kprobe | argError |
| uprobe | argError,argRegs,argNewSymbol,argNewAddr,argNewOffset |
| lsmhooks | argError |
Override action allows to modify the return value of call. While Sigkill
will terminate the entire process responsible for making the call, Override
will run in place of the original probed function and return the value
specified in the argError field. It’s then up to the code path or the user
space process handling the returned value to whether stop or proceed with the
execution.
For example, you can create a TracingPolicy that intercepts sys_symlinkat
and will make it return -1 every time the first argument is equal to the
string /etc/passwd:
kprobes:
- call: "sys_symlinkat"
syscall: true
args:
- index: 0
type: "string"
- index: 1
type: "int"
- index: 2
type: "string"
selectors:
- matchArgs:
- index: 0
operator: "Equal"
values:
- "/etc/passwd\0"
matchActions:
- action: Override
argError: -1
Override uses the kernel error injection framework and is only available
on kernels compiled with CONFIG_BPF_KPROBE_OVERRIDE configuration option.
Overriding system calls is the primary use case, but there are other kernel
functions that support error injections too. These functions are annotated
with ALLOW_ERROR_INJECTION() in the kernel source, and can be identified by
reading the file /sys/kernel/debug/error_injection/list.
Starting from kernel version 5.7 overriding security_ hooks is also possible.
Similar to kprobe, the uprobe Override action allows to modify the return value
of user space call with argError argument, like:
uprobes:
- path: "test"
symbols:
- "func"
selectors:
- matchActions:
- action: Override
argError: 123
Note that it can be successfully used only when following conditions are met:
call instruction;int type;It’s also possible to override the traced symbol with a new symbol call, like:
uprobes:
- path: "test"
symbols:
- "malloc"
selectors:
- matchActions:
- action: Override
argNewSymbol: "malloc_patched"
or even with a new symbol offset or address, eg:
uprobes:
- path: "test"
symbols:
- "malloc"
selectors:
- matchActions:
- action: Override
argNewOffset: "0x0000115c"
or:
uprobes:
- path: "test"
symbols:
- "malloc"
selectors:
- matchActions:
- action: Override
argNewAddr: "0x00001137"
There are, however, some restrictions:
It’s possible to override specific registers with arbitrary value with argRegs
argument, like:
uprobes:
- path: "test"
symbols:
- "func"
selectors:
- matchActions:
- action: Override
argRegs:
- "rax=11"
- "rbp=(%rsp)"
- "rip=8(%rsp)"
- "rsp=8%rsp"
The argRegs argument is an array of strings where each string start with destination
register name followed by = and an assignment expression, which can be one of the
following types:
rax=11rbp=%rsprip=8%rsprbp=(%rsp)rsp=8(%rsp)The GetUrl action can be used to perform a remote interaction such as
triggering Thinkst canaries or any system that can be triggered via an URL
request. It uses the argUrl field to specify the URL to request using GET
method.
matchActions:
- action: GetUrl
argUrl: http://ebpf.io
The DnsLookup action can be used to perform a remote interaction such as
triggering Thinkst canaries or any system that can be triggered via an DNS
entry request. It uses the argFqdn field to specify the domain to lookup.
matchActions:
- action: DnsLookup
argFqdn: ebpf.io
The Post action allows an event to be transmitted to the agent, from
kernelspace to userspace. By default, all TracingPolicy hook will create an
event with the Post action except in those situations:
NoPost action was specified in a matchActions;This action allows you to specify parameters for the Post action.
Post takes the rateLimit parameter with a time value. This value defaults
to seconds, but post-fixing ’m’ or ‘h’ will cause the value to be interpreted
in minutes or hours. When this parameter is specified for an action, that
action will check if the same action has fired, for the same thread, within
the time window, with the same inspected arguments. (Only the first 40 bytes
of each inspected argument is used in the matching. Only supported on kernels
v5.3 onwards.)
For example, you can specify a selector to only generate an event every 5 minutes with adding the following action and its paramater:
matchActions:
- action: Post
rateLimit: 5m
By default, the rate limiting is applied per thread, meaning that only repeated actions by the same thread will be rate limited. This can be expanded to all threads for a process by specifying a rateLimitScope with value “process”; or can be expanded to all processes by specifying the same with the value “global”.
Post takes the kernelStackTrace parameter, when turned to true (by default to
false) it enables dump of the kernel stack trace to the hook point in kprobes
events. To dump user space stack trace set userStackTrace parameter to true.
For example, the following kprobe hook can be used to retrieve the
kernel stack to kfree_skb_reason, the function called in the kernel to drop
kernel socket buffers.
kprobes:
- call: kfree_skb_reason
selectors:
- matchActions:
- action: Post
kernelStackTrace: true
userStackTrace: true
By default Tetragon does not expose the linear addresses from kernel space or
user space, you need to enable the flag --expose-stack-addresses to get the
addresses along the rest.
Note that the Tetragon agent is using its privilege to read the kernel symbols and their address. Being able to retrieve kernel symbols address can be used to break kernel address space layout randomization (KASLR) so only privileged users should be able to enable this feature and read events containing stack traces. The same thing we can say about retrieving address for user mode processes. Stack trace addresses can be used to bypass address space layout randomization (ASLR).
Once loaded, events created from this policy will contain a new kernel_stack_trace
field on the process_kprobe event with an output similar to:
{
"address": "18446744072119856613",
"offset": "5",
"symbol": "kfree_skb_reason"
},
{
"address": "18446744072119769755",
"offset": "107",
"symbol": "__sys_connect_file"
},
{
"address": "18446744072119769989",
"offset": "181",
"symbol": "__sys_connect"
},
[...]
The “address” is the kernel function address, “offset” is the offset into the native instruction for the function and “symbol” is the function symbol name.
User mode stack trace is contained in user_stack_trace field on the
process_kprobe event and looks like:
{
"address": "140498967885099",
"offset": "1209643",
"symbol": "__connect",
"module": "/usr/lib/x86_64-linux-gnu/libc.so.6"
},
{
"address": "140498968021470",
"offset": "1346014",
"symbol": "inet_pton",
"module": "/usr/lib/x86_64-linux-gnu/libc.so.6"
},
{
"address": "140498971185511",
"offset": "106855",
"module": "/usr/lib/x86_64-linux-gnu/libcurl.so.4.7.0"
},
The “address” is the function address, “offset” is the function offset from the beginning of the binary module. “module” is the absolute path of the binary file to which address belongs. “symbol” is the function symbol name. “symbol” may be missing if the binary file is stripped.
Information from procfs (/proc/<pid>/maps) is used to symbolize user
stack trace addresses. Stack trace addresses extraction and symbolizing are async.
It might happen that process is terminated and the /proc/<pid>/maps file will be
not existed at user stack trace symbolization step. In such case user stack traces
for very short living process might be not collected.
For Linux kernels before 5.15 user stack traces may be incomplete (some stack traces entries may be missed).
This output can be enhanced in a more human friendly using the tetra getevents -o compact command. Indeed, by default, it will print the stack trace along
the compact output of the event similarly to this:
❓ syscall /usr/bin/curl kfree_skb_reason
Kernel:
0xffffffffa13f2de5: kfree_skb_reason+0x5
0xffffffffa13dda9b: __sys_connect_file+0x6b
0xffffffffa13ddb85: __sys_connect+0xb5
0xffffffffa13ddbd8: __x64_sys_connect+0x18
0xffffffffa1714bd8: do_syscall_64+0x58
0xffffffffa18000e6: entry_SYSCALL_64_after_hwframe+0x6e
User space:
0x7f878cf2752b: __connect (/usr/lib/x86_64-linux-gnu/libc.so.6+0x12752b)
0x7f878cf489de: inet_pton (/usr/lib/x86_64-linux-gnu/libc.so.6+0x1489de)
0x7f878d1b6167: (/usr/lib/x86_64-linux-gnu/libcurl.so.4.7.0+0x1a167)
The printing format for kernel stack trace is "0x%x: %s+0x%x", address, symbol, offset.
The printing format for user stack trace is "0x%x: %s (%s+0x%x)", address, symbol, module, offset.
0x0, see the above note on
--expose-stack-addresses for more info.Post takes the imaHash parameter, when turned to true (by default to
false) it adds file hashes in LSM events calculated by Linux integrity subsystem.
The following list of LSM hooks is supported:
First, you need to be sure that LSM BPF is enabled.
To verify if IMA-measurement is available use the following command:
cat /boot/config-$(uname -r) | grep "CONFIG_IMA\|CONFIG_INTEGRITY"
The output should be similar to this if IMA-measurement is supported:
CONFIG_INTEGRITY=y
CONFIG_IMA=y
If provided above conditions are met, you can enable IMA-measurement by modifying /etc/deault/grub:
GRUB_CMDLINE_LINUX="lsm=integrity,bpf ima_policy=tcb"
Then, update the grub configuration and restart the system.
ima_policy= is used to define which files will be measured. tcb measures all executables run,
all mmap’d files for execution (such as shared libraries), all kernel modules loaded,
and all firmware loaded. Additionally, a files opened for read by root are measured as well.
ima_policy= can be specified multiple times, and the result is the union of the policies.
To know more about ima_policy you can follow this link.
iversion. Mounting with iversion
helps IMA not recalculating hash if file is not changed. From kernel 6.1 iversion is by default.
It is not necessary to enable IMA to calculate hashes with Tetragon if you have kernel 6.1+.
But hashes will be recalculated no matter if file is not changed. See implementation details of
bpf_ima_file_hash helper.The provided example of TracingPolicy collects hashes of executed binaries from
zsh and bash interpreters:
apiVersion: cilium.io/v1alpha1
kind: TracingPolicy
spec:
lsmhooks:
- hook: "bprm_check_security"
args:
- index: 0
type: "linux_binprm"
selectors:
- matchBinaries:
- operator: "In"
values:
- "/usr/bin/zsh"
- "/usr/bin/bash"
matchActions:
- action: Post
imaHash: true
LSM event with file hash can look like this:
{
"process_lsm": {
"process": {
...
},
"parent": {
...
},
"function_name": "bprm_check_security",
"policy_name": "file-integrity-monitoring",
"args": [
{
"linux_binprm_arg": {
"path": "/usr/bin/grep",
"permission": "-rwxr-xr-x"
}
}
],
"action": "KPROBE_ACTION_POST",
"ima_hash": "sha256:73abb4280520053564fd4917286909ba3b054598b32c9cdfaf1d733e0202cc96"
},
}
ima_hash field contains information about hashing algorithm and the hash value itself
separated by ‘:’.
This output can be enhanced in a more human friendly using the
tetra getevents -e PROCESS_LSM -o compact command.
🔒 LSM user-nix /usr/bin/zsh bprm_check_security
/usr/bin/cat sha256:dd5526c5872cce104a80f4d4e7f787c56ab7686a5b8dedda0ba4e8b36a3c084c
🔒 LSM user-nix /usr/bin/zsh bprm_check_security
/usr/bin/grep sha256:73abb4280520053564fd4917286909ba3b054598b32c9cdfaf1d733e0202cc96
The NoPost action can be used to suppress the event to be generated, but at
the same time all its defined actions are performed.
It’s useful when you are not interested in the event itself, just in the action being performed.
Following example override openat syscall for “/etc/passwd” file but does not generate any event about that.
- call: "sys_openat"
return: true
syscall: true
args:
- index: 0
type: int
- index: 1
type: "string"
- index: 2
type: "int"
returnArg:
index: 0
type: "int"
selectors:
- matchPIDs:
matchArgs:
- index: 1
operator: "Equal"
values:
- "/etc/passwd"
matchActions:
- action: Override
argError: -2
- action: NoPost
The TrackSock action allows to create a mapping using a BPF map between sockets
and processes. It however needs to maintain a state
correctly, see UntrackSock related action.
It is however more likely that socket tracking will be performed on the return
value of sk_alloc as described above.
Socket tracking is only available on kernel >=5.3.
The UntrackSock action takes a struct sock pointer from a function call and deletes
the corresponding entry from the BPF map, where it was put under the TrackSock
action.
Let’s take a look at the following example:
- call: "__sk_free"
syscall: false
args:
- index: 0
type: sock
selectors:
- matchActions:
- action: UntrackSock
argSock: 0
Similar to the TrackSock action, the index of the sock is described under argSock:
- matchActions:
- action: UntrackSock
argSock: 0
In this example, argSock is 0. So, the argument from the __sk_free function
call at index: 0 will be deleted from the BPF map whenever a __sk_free is
executed.
- index: 0
type: "sock"
TrackSock block,
there should be a matching UntrackSock block, otherwise the BPF map will be
broken.Socket tracking is only available on kernel >=5.3.
The NotifyEnforcer action notifies the enforcer program to kill or override a syscall.
It’s meant to be used on systems with kernel that lacks multi kprobe feature, that allows to attach many kprobes quickly). To workaround that the enforcer sensor uses the raw syscall tracepoint and attaches simple program to syscalls that we need to kill or override.
The specs needs to have enforcer program definition, that instructs tetragon to load
the enforcer program and attach it to specified syscalls.
spec:
enforcers:
- calls:
- "list:dups"
The syscalls expects list of syscalls or list:XXX pointer to list.
Note that currently only single enforcer definition is allowed.
The NotifyEnforcer action takes 2 arguments.
matchActions:
- action: "NotifyEnforcer"
argError: -1
argSig: 9
If specified the argError will be passed to bpf_override_return helper to override the syscall return value.
If specified the argSig will be passed to bpf_send_signal helper to override the syscall return value.
The following is spec for killing /usr/bin/bash program whenever it calls sys_dup or sys_dup2 syscalls.
spec:
lists:
- name: "dups"
type: "syscalls"
values:
- "sys_dup"
- "sys_dup2"
enforcers:
- calls:
- "list:dups"
tracepoints:
- subsystem: "raw_syscalls"
event: "sys_enter"
args:
- index: 4
type: "syscall64"
selectors:
- matchArgs:
- index: 0
operator: "InMap"
values:
- "list:dups"
matchBinaries:
- operator: "In"
values:
- "/usr/bin/bash"
matchActions:
- action: "NotifyEnforcer"
argSig: 9
Note as mentioned above the NotifyEnforcer with enforcer program is meant to be used only on kernel versions
with no support for fast attach of multiple kprobes (kprobe_multi link).
With kprobe_multi link support the above example can be easily replaced with:
spec:
lists:
- name: "syscalls"
type: "syscalls"
values:
- "sys_dup"
- "sys_dup2"
kprobes:
- call: "list:syscalls"
selectors:
- matchBinaries:
- operator: "In"
values:
- "/usr/bin/bash"
matchActions:
- action: "Sigkill"
The Set action is specific for USDT probes and allows tetragon to write
value to configured USDT probe argument. This argument needs to meet few
conditions:
USDT deref argumentFollowing command displays binary’s ELF notes which includes all defined USDT probes.
$ readelf -n ./usdt-override
...
Displaying notes found in: .note.stapsdt
Owner Data size Description
stapsdt 0x0000003e NT_STAPSDT (SystemTap probe descriptors)
Provider: tetragon
Name: test
Location: 0x0000000000001135, Base: 0x0000000000002004, Semaphore: 0x0000000000000000
Arguments: -4@-4(%rsp) -4@$1 -4@$2
-4@-4(%rsp) for first argument load, which is USDT deref.-4 in -4@-4(%rsp) stands for signed 4 bytes type.Following C example is source for usdt-override from above. It defines USDT
probe with 3 arguments and first one meets the criteria for USDT return.
int main(int argc, char **argv)
{
volatile int ret = 0;
int arg_1, arg_2;
...
USDT(tetragon, test, ret, arg_1, arg_2);
if (ret)
return -1;
...
Note the volatile used for ret variable that ensures it will be used
via memory dereferencing in USDT probe.
We can then use following tetragon policy to trace this USDT probe and
force value 1 for output argument in case the Set action is executed.
spec:
usdts:
- path: ".../usdt-override"
provider: "tetragon"
name: "test"
args:
- index: 0
type: "int32"
- index: 1
type: "int32"
- index: 2
type: "int32"
selectors:
- matchActions:
- action: Set
argIndex: 0
argValue: 1
The Set action uses following arguments:
argIndex defines position of the return argument.argValue defined the actual value to write.The selector semantics of the CiliumTracingPolicy follows the standard
Kubernetes semantics and the principles that are used by Cilium to create a
unified policy definition.
To explain deeper the structure and the logic behind it, let’s consider first the following example:
selectors:
- matchPIDs:
- operator: In
followForks: true
values:
- pid1
- pid2
- pid3
matchArgs:
- index: 0
operator: "Equal"
values:
- fdString1
In the YAML above matchPIDs and matchArgs are logically AND together
giving the expression:
(pid in {pid1, pid2, pid3} AND arg0=fdstring1)
When multiple values are given, we apply the OR operation between them. In
case of having multiple values under the matchPIDs selector, if any value
matches with the given pid from pid1, pid2 or pid3 then we accept the
event:
pid==pid1 OR pid==pid2 OR pid==pid3
As an example, we can filter for sys_read() syscalls that were not part of
the container initialization and the main pod process and tried to read from
the /etc/passwd file by using:
selectors:
- matchPIDs:
- operator: NotIn
followForks: true
values:
- 0
- 1
matchArgs:
- index: 0
operator: "Equal"
values:
- "/etc/passwd"
Similarly, we can use multiple values under the matchArgs selector:
(pid in {pid1, pid2, pid3} AND arg0={fdstring1, fdstring2})
If any value matches with fdstring1 or fdstring2, specifically
(string==fdstring1 OR string==fdstring2) then we accept the event.
For example, we can monitor sys_read() syscalls accessing both the
/etc/passwd or the /etc/shadow files:
selectors:
- matchPIDs:
- operator: NotIn
followForks: true
values:
- 0
- 1
matchArgs:
- index: 0
operator: "Equal"
values:
- "/etc/passwd"
- "/etc/shadow"
When multiple operators are supported under matchPIDs or matchArgs, they
are logically AND together. In case if we have multiple operators under
matchPIDs:
selectors:
- matchPIDs:
- operator: In
followForks: true
values:
- pid1
- operator: NotIn
followForks: true
values:
- pid2
then we would build the following expression on the BPF side:
(pid == 0[following forks]) && (pid != 1[following forks])
In case of having multiple matchArgs:
selectors:
- matchPIDs:
- operator: In
followForks: true
values:
- pid1
- pid2
- pid3
matchArgs:
- index: 0
operator: "Equal"
values:
- 1
- index: 2
operator: "lt"
values:
- 500
Then we would build the following expression on the BPF side
(pid in {pid1, pid2, pid3} AND arg0=1 AND arg2 < 500)
There are different types supported for each operator. In case of matchArgs:
bpf_strnstr kfunc)bpf_strncasestr kfunc)The operator types Equal and NotEqual are used to test whether the certain
argument of a system call is equal to the defined value in the CR.
For example, the following YAML snippet matches if the argument at index 0 is
equal to /etc/passwd:
matchArgs:
- index: 0
operator: "Equal"
values:
- "/etc/passwd"
Both Equal and NotEqual are set operations. This means if multiple values
are specified, they are ORd together in case of Equal, and ANDd together
in case of NotEqual.
For example, in case of Equal the following YAML snippet matches if the
argument at index 0 is in the set of {arg0, arg1, arg2}.
matchArgs:
- index: 0
operator: "Equal"
values:
- "arg0"
- "arg1"
- "arg2"
The above would be executed in the kernel as
arg == arg0 OR arg == arg1 OR arg == arg2
In case of NotEqual the following YAML snippet matches if the argument at
index 0 is not in the set of {arg0, arg1}.
matchArgs:
- index: 0
operator: "NotEqual"
values:
- "arg0"
- "arg1"
The above would be executed in the kernel as
arg != arg0 AND arg != arg1
The operator type Mask performs and bitwise operation on the argument value
and defined values. The argument type needs to be one of the value types.
For example in following YAML snippet we match second argument for bits 1 and 9 (0x200 value). We could use single value 0x201 as well.
matchArgs:
- index: 2
operator: "Mask"
values:
- 1
- 0x200
The above would be executed in the kernel as
arg & 1 OR arg & 0x200
The value can be specified as hexadecimal (with 0x prefix) octal (with 0 prefix) or decimal value (no prefix).
The operator Prefix checks if the certain argument starts with the defined value,
while the operator Postfix compares if the argument matches to the defined value
as trailing.
The operators relating to ports, addresses and protocol are used with sock, skb,
sockaddr and socket
types. Port operators can accept a range of ports specified as min:max as well
as lists of individual ports. Address operators can accept IPv4/6 CIDR ranges as well
as lists of individual addresses.
The Protocol operator can accept integer values to match against, or the equivalent
IPPROTO_ enumeration. For example, UDP can be specified as either IPPROTO_UDP or 17;
TCP can be specified as either IPPROTO_TCP or 6.
The Family operator can accept integer values to match against or the equivalent
AF_ enumeration. For example, IPv4 can be specified as either AF_INET or 2; IPv6
can be specified as either AF_INET6 or 10.
The State operator can accept integer values to match against or the equivalent
TCP_ enumeration. For example, an established socket can be matched with
TCP_ESTABLISHED or 1; a closed socket with TCP_CLOSE or 7.
The InRange and NotInRange operators accept integer values that are within the
specified range or NOT respectively. The range interval is specified with : separating
minimum and maximum value and includes both values as part of range.
For example following YAML snippet we match all values that are NOT 1,2,3,4 or 5.
matchArgs:
- index: 2
operator: "NotInRange"
values:
- 1:5
In case of matchPIDs:
The operator types In and NotIn are used to test whether the pid of a
system call is found in the provided values list in the CR. Both In and
NotIn are set operations, which means if multiple values are specified they
are ORd together in case of In and ANDd together in case of NotIn.
For example, in case of In the following YAML snippet matches if the pid of a
certain system call is being part of the list of {0, 1}:
- matchPIDs:
- operator: In
followForks: true
isNamespacePID: true
values:
- 0
- 1
The above would be executed in the kernel as
pid == 0 OR pid == 1
In case of NotIn the following YAML snippet matches if the pid of a certain
system call is not being part of the list of {0, 1}:
- matchPIDs:
- operator: NotIn
followForks: true
isNamespacePID: true
values:
- 0
- 1
The above would be executed in the kernel as
pid != 0 AND pid != 1
In case of matchBinaries:
The In operator type is used to test whether a binary name of a system call
is found in the provided values list. For example, the following YAML snippet
matches if the binary name of a certain system call is being part of the list
of {binary0, binary1, binary2}:
- matchBinaries:
- operator: "In"
values:
- "binary0"
- "binary1"
- "binary2"
When multiple selectors are configured they are logically ORd together.
selectors:
- matchPIDs:
- operator: In
followForks: true
values:
- pid1
- pid2
- pid3
matchArgs:
- index: 0
operator: "Equal"
values:
- 1
- index: 2
operator: "lt"
values:
- 500
- matchPIDs:
- operator: In
followForks: true
values:
- pid1
- pid2
- pid3
matchArgs:
- index: 0
operator: "Equal"
values:
- 2
The above would be executed in kernel as:
(pid in {pid1, pid2, pid3} AND arg0=1 AND arg2 < 500) OR
(pid in {pid1, pid2, pid3} AND arg0=2)
Because BPF must be bounded we have to place limits on how many selectors can exist.
Equal, NotEqual,
GT, LT, etc.)fd or file arg): 8 on kernels ≥5.3, 2 on kernels <5.3For larger sets of values, consider using the InMap or NotInMap
operators which store values in a BPF map.
These are limited only by the amount of available memory.
InMap and NotInMap operators also support the range notation described
for the InRange operator. However, using range notation with InMap or
NotInMap consumes more memory, because each value in the range is added
individually to the map. For large ranges, prefer the InRange operator
instead.Return actions filters are a list of actions that execute when an return selector
matches. They are defined under matchReturnActions and currently support all
the Actions filter action types.
Tags are optional fields of a Tracing Policy that are used to categorize generated events.
Tags are specified in Tracing policies and will be part of the generated event.
apiVersion: cilium.io/v1alpha1
kind: TracingPolicy
metadata:
name: "file-monitoring-filtered"
spec:
kprobes:
- call: "security_file_permission"
message: "Sensitive file system write operation"
syscall: false
args:
- index: 0
type: "file" # (struct file *) used for getting the path
- index: 1
type: "int" # 0x04 is MAY_READ, 0x02 is MAY_WRITE
selectors:
- matchArgs:
- index: 0
operator: "Prefix"
values:
- "/etc" # Writes to sensitive directories
- "/boot"
- "/lib"
- "/lib64"
- "/bin"
- "/usr/lib"
- "/usr/local/lib"
- "/usr/local/sbin"
- "/usr/local/bin"
- "/usr/bin"
- "/usr/sbin"
- "/var/log" # Writes to logs
- "/dev/log"
- "/root/.ssh" # Writes to sensitive files add here.
- index: 1
operator: "Equal"
values:
- "2" # MAY_WRITE
tags: [ "observability.filesystem", "observability.process" ]
Every kprobe call can have up to max 16 tags.
Events in this namespace relate to collect and export data about the internal system state.
Users can define their own tags inside Tracing Policies. The official supported tags are documented in the Namespaces section.
Tetragon is configured via TracingPolicies. Broadly speaking, TracingPolicies define what situations Tetragon should react to and how. The what can be, for example, specific system calls with specific argument values. The how defines what action the Tetragon agent should perform when the specified situation occurs. The most common action is generating an event, but there are others (e.g., returning an error without executing the function or killing the corresponding process).
Here, we discuss how to apply tracing policies only on a subset of pods running on the system via the followings mechanisms:
Tetragon implements these mechanisms in-kernel via eBPF. This is important for both observability and enforcement use-cases. For observability, copying only the relevant events from kernel- to user-space reduces overhead. For enforcement, performing the enforcement action in the kernel avoids the race-condition of doing it in user-space. For example, let us consider the case where we want to block an application from performing a system call. Performing the filtering in-kernel means that the application will never finish executing the system call, which is not possible if enforcement happens in user-space (after the fact).
To ensure that namespaced tracing policies are always correctly applied, Tetragon needs to perform actions before containers start executing. Tetragon supports this via OCI runtime hooks. If such hooks are not added, Tetragon will apply policies in a best-effort manner using information from the k8s API server.
For namespace filtering we use TracingPolicyNamespaced which has the same contents as a
TracingPolicy, but it is defined in a specific namespace and it is only applied to pods of that
namespace.
For pod label filters, we use the PodSelector field of tracing policies to select the pods that
the policy is applied to.
For container field filters, we use the containerSelector field of tracing policies to select the containers that the policy is applied to. At the moment, the only supported fields are name and repo which refers to the container repository.
To filter host workloads we use the hostSelector field of tracing policies to select if a policy
should be applied to host workloads or not. For now this only supports {} to match all host workloads
and null to match none of the host workloads.
TracingPolicyNamespaced can only apply to Pods within a specific
Kubernetes namespace, any non-null hostSelector will trigger an error.Based on these, the user can choose on which workloads does a policy apply.
The selectors above (podSelector, containerSelector, hostSelector) filter
which workloads a policy applies to; the policy is still loaded by the
Tetragon agent on every node. To restrict policy loading to specific nodes, use
the nodeSelector field.
nodeSelector is a standard Kubernetes label selector matched against the
labels of the node each Tetragon agent runs on. An agent loads the policy only
when its own node’s labels match. This is useful for policies that are
expensive, noisy, or only relevant on a subset of nodes — for example GPU
nodes, a specific architecture or OS, or a canary node pool.
Unlike hostSelector, arbitrary matchLabels and matchExpressions are
supported. If nodeSelector is empty ({}) or omitted, the policy is loaded on
all nodes, preserving the default behavior. nodeSelector is supported on both
TracingPolicy and TracingPolicyNamespaced.
The following example loads the policy only on nodes labeled nodepool: gpu
with an amd64 architecture:
spec:
nodeSelector:
matchLabels:
nodepool: gpu
matchExpressions:
- key: kubernetes.io/arch
operator: In
values:
- amd64
kprobes:
When a node is relabeled at runtime, each agent re-evaluates its policies and loads or unloads them accordingly.
A policy that a node does not load because its nodeSelector does not match is
not silently dropped: it is reported with the skipped state (rather than being
absent) in tetra tracingpolicy list, so a gated-out policy is distinguishable
from a missing one.
nodeSelector is evaluated by the Tetragon agent against the Kubernetes node it
runs on, so it only applies to policies managed through the Kubernetes API
(TracingPolicy and TracingPolicyNamespaced). Policies loaded directly from a
file or through the gRPC API are not subject to nodeSelector.nodeSelector
fails open so a transient error never silently drops a policy.nodeSelector keys are read from the node’s labels, any user that
can edit node labels can change which policies an agent loads — including
unloading an enforcement policy by relabeling the node. When gating enforcement
policies (for example Sigkill), restrict who can modify the node labels used
in the selector, and prefer labels that are set at node provisioning time and
not writable by untrusted workloads.The following table summarizes how different combinations of hostSelector, podSelector, and containerSelector behave.
hostSelector | podSelector | containerSelector | Result |
|---|---|---|---|
null (default) | null (default) | null (default) | Select all host, pod, and container workloads. |
null (default) | null (default) | {...} | Select all containers that match containerSelector across all pods. No host workloads are selected. |
null (default) | {...} | null (default) | Select all containers in pods that match podSelector. No host workloads are selected. |
null (default) | {...} | {...} | Select all containers that match containerSelector in pods that match podSelector. No host workloads are selected. |
{} | null (default) | null (default) | Select all host workloads. |
{} | null (default) | {...} | Select all host workloads, plus all containers that match containerSelector across all pods. |
{} | {...} | null (default) | Select all host workloads, plus all containers in pods that match podSelector. |
{} | {...} | {...} | Select all host workloads, plus all containers that match containerSelector in pods that match podSelector. |
hostSelector, podSelector, and containerSelector are all left at their default
value of null (that is, they are omitted), this is treated as a special case: workload
filtering is disabled entirely, and all host and pod/container workloads are selected.By default, a policy match on all workloads, similar to the following example:
apiVersion: cilium.io/v1alpha1
kind: TracingPolicy
metadata:
name: "workload-filtering"
spec:
kprobes:
In that case all of hostSelector, podSelector, and containerSelector have the default value null.
The following example will match only host workloads.
spec:
hostSelector: {}
kprobes:
The following example will match only pod workloads.
spec:
podSelector: {}
kprobes:
containerSelector acts as a second level filtering on the podSelector. This means that first the
podSelector is evaluated and if pod match we then apply the containerSelector. The following example
will match all pods inside the kube-system namespace and all host workloads.
spec:
hostSelector: {}
podSelector:
matchExpressions:
- key: "k8s:io.kubernetes.pod.namespace"
operator: In
values:
- "kube-system"
For this demo, we use containerd and configure appropriate run-time hooks.
First, let us start a cluster, build and load images, and install Tetragon and OCI hooks:
minikube start --container-runtime=containerd
./contrib/tetragon-rthooks/scripts/minikube-install-hook.sh
make image image-operator
minikube image load --daemon=true cilium/tetragon:latest cilium/tetragon-operator:latest
minikube ssh -- sudo mount bpffs -t bpf /sys/fs/bpf
helm install --namespace kube-system \
--set tetragonOperator.image.override=cilium/tetragon-operator:latest \
--set tetragon.image.override=cilium/tetragon:latest \
--set tetragon.grpc.address="unix:///var/run/tetragon/tetragon.sock" \
tetragon ./install/kubernetes/tetragonkind create cluster
./contrib/tetragon-rthooks/scripts/kind-hook-setup.sh
make image image-operator
kind load docker-image cilium/tetragon:latest cilium/tetragon-operator:latest
helm install --namespace kube-system \
--set tetragonOperator.image.override=cilium/tetragon-operator:latest \
--set tetragon.image.override=cilium/tetragon:latest \
--set tetragon.grpc.address="unix:///var/run/tetragon/tetragon.sock" \
tetragon ./install/kubernetes/tetragonOnce the tetragon pod is up and running, we can get its name and store it in a variable for convenience.
tetragon_pod=$(kubectl -n kube-system get pods -l app.kubernetes.io/name=tetragon -o custom-columns=NAME:.metadata.name --no-headers)
Once the tetragon operator pod is up and running, we can also get its name and store it in a variable for convenience.
tetragon_operator=$(kubectl -n kube-system get pods -l app.kubernetes.io/name=tetragon-operator -o custom-columns=NAME:.metadata.name --no-headers)
Next, we check the tetragon-operator logs and tetragon agent logs to ensure that everything is in order.
First, we check if the operator installed the TracingPolicyNamespaced CRD.
kubectl -n kube-system logs -c tetragon-operator $tetragon_operator
The expected output is:
level=info msg="Tetragon Operator: " subsys=tetragon-operator
level=info msg="CRD (CustomResourceDefinition) is installed and up-to-date" name=TracingPolicy/v1alpha1 subsys=k8s
level=info msg="Creating CRD (CustomResourceDefinition)..." name=TracingPolicyNamespaced/v1alpha1 subsys=k8s
level=info msg="CRD (CustomResourceDefinition) is installed and up-to-date" name=TracingPolicyNamespaced/v1alpha1 subsys=k8s
level=info msg="Initialization complete" subsys=tetragon-operator
Next, we check that policyfilter (the low-level mechanism that implements the desired functionality) is indeed enabled.
kubectl -n kube-system logs -c tetragon $tetragon_pod
The output should include:
level=info msg="Enabling policy filtering"
For illustration purposes, we will use the lseek system call with an invalid argument. Specifically a file descriptor (the first argument) of -1. Normally, this operation would return a “Bad file descriptor error”.
Let us start a pod in the default namespace:
kubectl -n default run test --image=python -it --rm --restart=Never -- python
Above command will result in the following python shell:
If you don't see a command prompt, try pressing enter.
>>>
There is no policy installed, so attempting to do the lseek operation will just return an error. Using the python shell, we can execute an lseek and see the returned error.
>>> import os
>>> os.lseek(-1,0,0)
Traceback (most recent call last):
File "<stdin>", line 1, in <module>
OSError: [Errno 9] Bad file descriptor
>>>
In another terminal, we install a policy in the default namespace:
cat << EOF | kubectl apply -n default -f -
apiVersion: cilium.io/v1alpha1
kind: TracingPolicyNamespaced
metadata:
name: "lseek-namespaced"
spec:
kprobes:
- call: "sys_lseek"
syscall: true
args:
- index: 0
type: "int"
selectors:
- matchArgs:
- index: 0
operator: "Equal"
values:
- "-1"
matchActions:
- action: Sigkill
EOF
The above tracing policy will kill the process that performs a lseek system call with a file
descriptor of -1. Note that we use a SigKill action only for illustration purposes because it’s
easier to observe its effects.
Then, attempting the lseek operation on the previous terminal, will result in the process getting killed:
>>> os.lseek(-1, 0, 0)
pod "test" deleted
pod default/test terminated (Error)
The same is true for a newly started container:
kubectl -n default run test --image=python -it --rm --restart=Never -- python
If you don't see a command prompt, try pressing enter.
>>> import os
>>> os.lseek(-1, 0, 0)
pod "test" deleted
pod default/test terminated (Error)
Doing the same on another namespace:
kubectl create namespace test
kubectl -n test run test --image=python -it --rm --restart=Never -- python
Will not kill the process and result in an error:
If you don't see a command prompt, try pressing enter.
>>> import os
>>> os.lseek(-1, 0, 0)
Traceback (most recent call last):
File "<stdin>", line 1, in <module>
OSError: [Errno 9] Bad file descriptor
Let’s install a tracing policy with a pod label filter.
cat << EOF | kubectl apply -f -
apiVersion: cilium.io/v1alpha1
kind: TracingPolicy
metadata:
name: "lseek-podfilter"
spec:
podSelector:
matchLabels:
app: "lseek-test"
kprobes:
- call: "sys_lseek"
syscall: true
args:
- index: 0
type: "int"
selectors:
- matchArgs:
- index: 0
operator: "Equal"
values:
- "-1"
matchActions:
- action: Sigkill
EOF
Pods without the label will not be affected:
kubectl run test --image=python -it --rm --restart=Never -- python
If you don't see a command prompt, try pressing enter.
>>> import os
>>> os.lseek(-1, 0, 0)
Traceback (most recent call last):
File "<stdin>", line 1, in <module>
OSError: [Errno 9] Bad file descriptor
>>>
But pods with the label will:
kubectl run test --labels "app=lseek-test" --image=python -it --rm --restart=Never -- python
If you don't see a command prompt, try pressing enter.
>>> import os
>>> os.lseek(-1, 0, 0)
pod "test" deleted
pod default/test terminated (Error)
Let’s install a tracing policy with a container field filter.
cat << EOF | kubectl apply -f -
apiVersion: cilium.io/v1alpha1
kind: TracingPolicy
metadata:
name: "lseek-containerfilter"
spec:
containerSelector:
matchExpressions:
- key: name
operator: In
values:
- main
kprobes:
- call: "sys_lseek"
syscall: true
args:
- index: 0
type: "int"
selectors:
- matchArgs:
- index: 0
operator: "Equal"
values:
- "-1"
matchActions:
- action: Sigkill
EOF
Let’s create a pod with 2 containers:
cat << EOF | kubectl apply -f -
apiVersion: v1
kind: Pod
metadata:
name: lseek-pod
spec:
containers:
- name: main
image: python
command: ['sh', '-c', 'sleep infinity']
- name: sidecar
image: python
command: ['sh', '-c', 'sleep infinity']
EOF
Containers that don’t match the name main will not be affected:
kubectl exec -it lseek-pod -c sidecar -- python3
>>> import os
>>> os.lseek(-1, 0, 0)
Traceback (most recent call last):
File "<stdin>", line 1, in <module>
OSError: [Errno 9] Bad file descriptor
>>>
But containers matching the name main will:
kubectl exec -it lseek-pod -c main -- python3
>>> import os
>>> os.lseek(-1, 0, 0)
command terminated with exit code 137
Beyond monitoring, Tetragon tracing policies include enforcement actions. Configuring the mode of a policy allows you to disable enforcement in a policy, without modifying the policy itself.
A tracing policy can be set in three modes:
monitoring: enforcement operations are elidedenforcement: enforcement operations are respected and performedmonitor_only: the policy has no enforcement actions, thus it cannot be set to enforcement modeUsing the tetra CLI, you can inspect the mode of each policy.
For example:
tetra tracingpolicy list
Will produce out similar to:
ID NAME DOMAIN STATE FILTERID NAMESPACE SENSORS KERNELMEMORY MODE NPOST NENFORCE NMONITOR
2 trace-bash-readline static enabled 0 (global) generic_uprobe 2.40 MB monitor_only 5 0 0
3 read-etc-passwd grpc enabled 0 (global) generic_kprobe 1.88 MB monitor_only 33 0 0
There are three ways that a policy mode can be set. From lower to higher priority, they are:
Trying to set the mode at runtime for a monitor_only policy will result in an error.
Loading it will always succeed, even with a mode specified. In that case, a warning will be logged.
The policy mode can be set in the spec.options field, under the policy-mode key.
For example:
apiVersion: cilium.io/v1alpha1
kind: TracingPolicyNamespaced
metadata:
name: "enforce-policy"
namespace: "default"
spec:
options:
- name: "policy-mode"
value: "monitor"
...
This can be done via the tetra CLI:
tetra tracingpolicy add --mode monitor policy.yaml
Will load policy.yaml in monitor mode.
You can use the tetra CLI to set the policy mode once the policy is loaded.
For example:
tetra tp set-mode --namespace pizza enforce-security enforce
Applying Kubernetes Identity Aware Policies requires information about Kubernetes (K8s) pods (e.g., namespaces and labels). Based on this information, the Tetragon agent can update the state so that Kubernetes Identify filtering can be applied in-kernel via BPF.
One way that this information is available to the Tetragon agent is via the K8s API server. Relying on the API server, however, can lead to a delay before the container starts and the policy is applied. This might be undesirable, especially for enforcement policies.
Runtime hooks address this issue by “hooking” into the container run-time system, and ensuring that the Tetragon agent sets up the necessary state for filtering before the container starts.
The OCI hooks are implemented via a tetragon-oci-hook binary which is responsible for contacting
the agent via a gRPC socket. tetragon-oci-hook can be configured to either fail or succeed when
connecting to the tetragon agent fails (this is needed, so that Tetragon itself, as well as other
mission critical containers can be started).
┌────────────────────┐ ┌────────────────────┐ ┌──────────────────┐
│ tetragon-oci-hook │ │ tetragon.sock │ │ tetragon agent │
│ (binary) │─────────┤ (gRPC UNIX socket) │──────► │ │
│ │ │ │ │ │
└────────────────────┘ └────────────────────┘ └──────────────────┘
Depending on the container runtime, there are different ways to configure the runtime so that
tetragon-oci-hook is executed before a container starts:
CRI-O implements the OCI hooks configuration directories as described in: https://github.com/containers/common/blob/main/pkg/hooks/docs/oci-hooks.5.md. Hence, enabling the hook requires adding an appropriate file to this directory.
Recent versions of containerd support NRI: NRI support was
added in 1.7 and will be enabled by
default starting with
2.0.
To use tetragon-oci-hook with NRI, there is a simple NRI plugin (called tetragon-nri-hook) that
adds the tetragon-oci-hook to the container spec.
Containerd can be configured to use a custom container spec that includes tetragon-oci-hook.
Tetragon allows enforcing events in the kernel inline with the operation itself. This document describes the types of enforcement provided by Tetragon and concerns policy implementors must be aware of.
There are two ways that Tetragon performs enforcement: overriding the return value of a function and
sending a signal (e.g., SIGKILL) to the process.
Override the return value of a call means that the function will never be executed and, instead, a value (typically an error) will be returned to the caller. Generally speaking, only system calls and security check functions allow to change their return value in this manner. Details about how users can configure tracing policies to override the return value can be found in the Override action documentation.
Another type of enforcement is signals. For example, users can write a TracingPolicy (details can be
found in the Signal action
documentation) that sends a SIGKILL to a process matching certain criteria and thus terminate it.
In contrast with overriding the return value, sending a SIGKILL signal does not always stop the
operation being performed by the process that triggered the operation. For example, a SIGKILL sent
in a write() system call does not guarantee that the data will not be written to the file.
However, it does ensure that the process is terminated synchronously (and any threads will be
stopped). In some cases it may be sufficient to ensure the process is stopped and the process does
not handle the return of the call. To ensure the operation is not completed, though, the Signal
action should be combined with the Override action.
This page shows you how to configure persistent enforcement.
The idea of persistent enforcement is to allow the enforcement policy to continue running even when its tetragon process is gone.
This is configured with the --keep-sensors-on-exit option.
When the tetragon process exits, the policy stays active because it’s pinned
in sysfs bpf tree under /sys/fs/bpf/tetragon directory.
When a new tetragon process is started, it performs the following actions:
/sys/fs/bpf/tetragon and moves it to
/sys/fs/bpf/tetragon_old directory;/sys/fs/bpf/tetragon_old directory.This example shows how the persistent enforcement works on simple tracing policy.
Consider the following enforcement tracing policy that kills any process that touches /tmp/tetragon file.
apiVersion: cilium.io/v1alpha1
kind: TracingPolicy
metadata:
name: "enforcement"
spec:
kprobes:
- call: "fd_install"
syscall: false
args:
- index: 0
type: int
- index: 1
type: "file"
selectors:
- matchArgs:
- index: 1
operator: "Equal"
values:
- "/tmp/tetragon"
matchActions:
- action: Sigkill
Spawn tetragon with the above policy and --keep-sensors-on-exit option.
tetragon --bpf-lib bpf/objs/ --keep-sensors-on-exit --tracing-policy enforcement.yaml
Verify that the enforcement policy is in place.
cat /tmp/tetragon
The output should be similar to
Killed
Kill tetragon with CTRL+C.
time="2024-07-26T14:47:45Z" level=info msg="Perf ring buffer size (bytes)" percpu=68K total=272K
time="2024-07-26T14:47:45Z" level=info msg="Perf ring buffer events queue size (events)" size=63K
time="2024-07-26T14:47:45Z" level=info msg="Listening for events..."
^C
time="2024-07-26T14:50:50Z" level=info msg="Received signal interrupt, shutting down..."
time="2024-07-26T14:50:50Z" level=info msg="Listening for events completed." error="context canceled"
Verify that the enforcement policy is STILL in place.
cat /tmp/tetragon
The output should be still similar to
Killed
At the moment we are not able to receive any events during the tetragon down time, only the the enforcement is in place.
Tetragon can persist tracing policies installed through the gRPC API and restore their desired state after the agent restarts. Combined with persistent enforcement, this allows the old BPF programs to remain active while Tetragon loads replacement programs from the stored policies.
This feature applies only to policies installed through gRPC, including
policies added with tetra tracingpolicy add. Kubernetes and statically loaded
policies continue to be managed by their respective policy sources.
Start Tetragon with the following options:
sudo ./tetragon \
--btf /sys/kernel/btf/vmlinux \
--bpf-lib ./bpf/objs/ \
--keep-sensors-on-exit \
--release-pinned-bpf=false \
--persist-grpc-policies \
--persist-grpc-policies-dir /var/run/tetragon/grpc-policies
Use the same options each time Tetragon starts.
--release-pinned-bpf defaults to true. Set it explicitly to false when
continuous enforcement across an agent restart is required. Enabling only the
policy store restores policies, but does not preserve the previous BPF tree
during startup.The options have the following roles:
--keep-sensors-on-exit leaves pinned sensors active when Tetragon exits.--release-pinned-bpf=false prevents Tetragon from removing the previous BPF
tree at the beginning of startup. Tetragon moves the tree aside and removes
it only after replacement policies have loaded.--persist-grpc-policies enables saving and restoring policies installed
through gRPC.--persist-grpc-policies-dir selects the policy store directory. Its default
value is /var/run/tetragon/grpc-policies.On a normal restart, Tetragon performs the following handoff:
/sys/fs/bpf/tetragon to /sys/fs/bpf/tetragon_old. The links pinned
below this directory keep the previous BPF programs attached./sys/fs/bpf/tetragon tree and load the initial sensors./sys/fs/bpf/tetragon_old, which detaches the previous programs.The policies are rebuilt from the persistent store; Tetragon does not reload
them from tetragon_old. The old BPF tree exists only to maintain coverage
during the handoff.
Policies added through gRPC are persisted automatically after they load successfully:
sudo ./tetra tracingpolicy add policy.yaml
Deleting a policy removes it from both the running agent and the persistent store:
sudo ./tetra tracingpolicy delete policy-name
Enable and disable operations update the stored desired state:
sudo ./tetra tracingpolicy disable policy-name
sudo ./tetra tracingpolicy enable policy-name
Mode changes also update the stored policy YAML:
sudo ./tetra tracingpolicy set-mode policy-name monitor
sudo ./tetra tracingpolicy set-mode policy-name enforce
The store uses one JSON record per policy. A policy is uniquely identified by its domain, namespace, and name.
Each record contains:
yaml: the complete policy, including its configured policy mode;enabled: whether the policy is enabled or not.The policy identity is encoded in the record filename as
<name>:<namespace>:<domain>.json.
For example:
{
"yaml": "apiVersion: cilium.io/v1alpha1\nkind: TracingPolicy\nmetadata:\n name: lsm-file-open\nspec:\n options:\n - name: policy-mode\n value: monitor\n lsmhooks:\n - hook: file_open\n",
"enabled": true
}
The running policy and its stored desired state are updated together:
At startup, Tetragon validates every stored policy before loading any of them. If loading a policy fails, it rolls back policies restored earlier in the same startup attempt and reports the error. The old BPF tree is removed only after startup policy loading succeeds.
This page shows you how to configure per-cgroup rate monitoring.
The idea is that tetragon monitors events rate per cgroup and throttle them (stops posting its events) if they cross configured threshold.
The throttled cgroup is monitored and if its traffic gets stable under the limit again, it stops the cgroup throttling and tetragon resumes receiving the cgroup’s events.
The throttle action generates following events:
THROTTLE start event is sent when the group rate limit is crossedTHROTTLE stop event is sent when the cgroup rate is again below the limit stable for 5 secondsAt the moment we monitor and limit base sensor events:
PROCESS_EXECPROCESS_EXITThe cgroup rate is configured with --cgroup-rate option:
--cgroup-rate string
Base sensor events cgroup rate <events,interval> disabled by default
('1000,1s' means rate 1000 events per second)
--cgroup-rate=10,1s
sets the cgroup threshold on 10 events per 1 second
--cgroup-rate=1000,1s
sets the cgroup threshold on 1000 events per 1 second
--cgroup-rate=100,1m
sets the cgroup threshold on 100 events per 1 minute
--cgroup-rate=10000,10m
sets the cgroup threshold on 10000 events per 10 minutes
The throttle events contains fields as follows.
THROTTLE_START
{
"process_throttle": {
"type": "THROTTLE_START",
"cgroup": "session-429.scope"
},
"node_name": "ubuntu-22",
"time": "2024-07-26T13:07:43.178407128Z"
}
THROTTLE_STOP
{
"process_throttle": {
"type": "THROTTLE_STOP",
"cgroup": "session-429.scope"
},
"node_name": "ubuntu-22",
"time": "2024-07-26T13:07:55.501718877Z"
}
This example shows how to generate throttle events when cgroup rate monitoring is enabled.
Start tetragon with cgroup rate monitoring 10 events per second.
tetragon --bpf-lib ./bpf/objs/ --cgroup-rate=10,1s
The successful configuration will show in tetragon log.
...
time="2024-07-26T13:33:19Z" level=info msg="Cgroup rate started (10/1s)"
...
Spawn more than 10 events per second.
while :; do sleep 0.001s; done
Monitor events shows throttling.
tetra getevents -o compact
The output should be similar to:
🚀 process ubuntu-22 /usr/bin/sleep 0.001s
💥 exit ubuntu-22 /usr/bin/sleep 0.001s 0
🚀 process ubuntu-22 /usr/bin/sleep 0.001s
💥 exit ubuntu-22 /usr/bin/sleep 0.001s 0
🚀 process ubuntu-22 /usr/bin/sleep 0.001s
💥 exit ubuntu-22 /usr/bin/sleep 0.001s 0
🚀 process ubuntu-22 /usr/bin/sleep 0.001s
💥 exit ubuntu-22 /usr/bin/sleep 0.001s 0
🚀 process ubuntu-22 /usr/bin/sleep 0.001s
💥 exit ubuntu-22 /usr/bin/sleep 0.001s 0
🚀 process ubuntu-22 /usr/bin/sleep 0.001s
💥 exit ubuntu-22 /usr/bin/sleep 0.001s 0
🚀 process ubuntu-22 /usr/bin/sleep 0.001s
🧬 throttle START session-429.scope
🚀 process ubuntu-22 /usr/bin/sleep 0.001s
💥 exit ubuntu-22 /usr/bin/sleep 0.001s 0
🚀 process ubuntu-22 /usr/bin/sleep 0.001s
💥 exit ubuntu-22 /usr/bin/sleep 0.001s 0
🚀 process ubuntu-22 /usr/bin/sleep 0.001s
💥 exit ubuntu-22 /usr/bin/sleep 0.001s 0
🚀 process ubuntu-22 /usr/bin/sleep 0.001s
💥 exit ubuntu-22 /usr/bin/sleep 0.001s 0
🚀 process ubuntu-22 /usr/bin/sleep 0.001s
🚀 process ubuntu-22 /usr/bin/sleep 0.001s
💥 exit ubuntu-22 /usr/bin/sleep 0.001s 0
🚀 process ubuntu-22 /usr/bin/sleep 0.001s
💥 exit ubuntu-22 /usr/bin/sleep 0.001s 0
🚀 process ubuntu-22 /usr/bin/sleep 0.001s
💥 exit ubuntu-22 /usr/bin/sleep 0.001s 0
🚀 process ubuntu-22 /usr/bin/sleep 0.001s
🧬 throttle STOP session-429.scope
When you stop the while loop from the other terminal you will get above
throttle STOP event after 5 seconds.
PROCESS_EXECPROCESS_EXITThe Policy Library provides structured examples of Tetragon policies paired with relevant use cases. You can explore all documented policies, along with additional examples, in the policy library directory on Github.
For further community-maintained policy examples, refer to the policy examples directory on GitHub. These examples are valid policies provided by the community but they are not curated in terms of suitability for specific use cases or best practices.
Monitor execution of a binary in the /tmp directory.
Preventing execution of executables in /tmp is a common best-practice as several canned exploits rely on writing and then executing malicious binaries in the /tmp directory. A common best-practice to enforce this is to mount the /tmp filesystem with the noexec flag. This observability policy is used to monitor for violations of this best practice.
No policy needs to be loaded, standard process execution observability is sufficient.
jq 'select(.process_exec != null) | select(.process_exec.process.binary | contains("/tmp/")) | "\(.time) \(.process_exec.process.pod.namespace) \(.process_exec.process.pod.name) \(.process_exec.process.binary) \(.process_exec.process.arguments)"'
"2023-10-31T18:44:22.777962637Z default/xwing /tmp/nc ebpf.io 1234"
Monitor sudo invocations
sudo is used to run executables with particular privileges. Creating a audit log of sudo invocations is a common best-practice.
No policy needs to be loaded, standard process execution observability is sufficient.
jq 'select(.process_exec != null) | select(.process_exec.process.binary | contains("sudo")) | "\(.time) \(.process_exec.process.pod.namespace) \(.process_exec.process.binary) \(.process_exec.process.arguments)"'
"2023-10-31T19:03:35.273111185Z null /usr/bin/sudo -i"
Monitor execution of SUID “Set User ID” binaries.
The “Set User Identity” and “Set Group Identity” are permission flags. When set on a binary file, the binary will execute with the permissions of the owner or group associated with the executable file, rather than the user executing it. Usually it is used to run programs with elevated privileges to perform specific tasks.
Detecting the execution of setuid and setgid binaries is a common
best-practice as attackers may abuse such binaries, or even create them
during an exploit for subsequent execution.
Tetragon must run with the Process Credentials visibility enabled, please refer to Enable Process Credentials documentation.
No policy needs to be loaded, standard process execution observability is sufficient.
jq 'select(.process_exec != null) | select(.process_exec.process.binary_properties != null) | select(.process_exec.process.binary_properties.setuid != null or .process_exec.process.binary_properties.setgid != null) | "\(.time) \(.process_exec.process.pod.namespace) \(.process_exec.process.pod.name) \(.process_exec.process.binary) \(.process_exec.process.arguments) uid=\(.process_exec.process.process_credentials.uid) euid=\(.process_exec.process.process_credentials.euid) gid=\(.process_exec.process.process_credentials.gid) egid=\(.process_exec.process.process_credentials.egid) binary_properties=\(.process_exec.process.binary_properties)"'
"2024-02-05T20:20:50.828208246Z null null /usr/bin/sudo id uid=1000 euid=0 gid=1000 egid=1000 binary_properties={\"setuid\":0,\"privileges_changed\":[\"PRIVILEGES_RAISED_EXEC_FILE_SETUID\"]}"
"2024-02-05T20:20:57.008655978Z null null /usr/bin/wall hello uid=1000 euid=1000 gid=1000 egid=5 binary_properties={\"setgid\":5}"
"2024-02-05T20:21:00.116297664Z null null /usr/bin/su --help uid=1000 euid=0 gid=1000 egid=1000 binary_properties={\"setuid\":0,\"privileges_changed\":[\"PRIVILEGES_RAISED_EXEC_FILE_SETUID\"]}"
Monitor execution of binaries with file capabilities.
File capabilities allow the binary execution to acquire more privileges to perform specific tasks. They are stored in the extended attribute part of the binary on the file system. They can be set using the setcap tool.
For further reference, please check capabilities
man page; section File capabilities.
Detecting the execution of file capabilities binaries is a common
best-practice, since they cross privilege boundaries which make them a suitable
target for attackers. Such binaries are also used by attackers to hide their
privileges after a successful exploit.
Tetragon must run with the Process Credentials visibility enabled, please refer to Enable Process Credentials documentation.
No policy needs to be loaded, standard process execution observability is sufficient.
jq 'select(.process_exec != null) | select(.process_exec.process.binary_properties != null) | select(.process_exec.process.binary_properties.privileges_changed != null) | "\(.time) \(.process_exec.process.pod.namespace) \(.process_exec.process.pod.name) \(.process_exec.process.binary) \(.process_exec.process.arguments) uid=\(.process_exec.process.process_credentials.uid) euid=\(.process_exec.process.process_credentials.euid) gid=\(.process_exec.process.process_credentials.gid) egid=\(.process_exec.process.process_credentials.egid) caps=\(.process_exec.process.cap) binary_properties=\(.process_exec.process.binary_properties)"'
"2024-02-05T20:49:39.551528684Z null null /usr/bin/ping ebpf.io uid=1000 euid=1000 gid=1000 egid=1000 caps={\"permitted\":[\"CAP_NET_RAW\"],\"effective\":[\"CAP_NET_RAW\"]} binary_properties={\"privileges_changed\":[\"PRIVILEGES_RAISED_EXEC_FILE_CAP\"]}"
Monitor execution of the setuid() system calls family.
The setuid() and setgid() system calls family allow to change the effective user ID and group ID of the calling process.
Detecting setuid() and setgid() calls that set the user ID or group ID to root is a common best-practice to identify when privileges are raised.
The privileges-raise.yaml monitors the various interfaces of setuid() and setgid() to root.
jq 'select(.process_kprobe != null) | select(.process_kprobe.policy_name | test("privileges-raise")) | select(.process_kprobe.function_name | test("__sys_")) | "\(.time) \(.process_kprobe.process.pod.namespace) \(.process_kprobe.process.pod.name) \(.process_kprobe.process.binary) \(.process_kprobe.process.arguments) \(.process_kprobe.function_name) \(.process_kprobe.args)"'
"2024-02-05T15:23:24.734543507Z null null /usr/local/sbin/runc --root /run/containerd/runc/k8s.io --log /run/containerd/io.containerd.runtime.v2.task/k8s.io/024daa4cc70eb683355f6f67beda3012c65d64f479d958e421cd209738a75392/log.json --log-format json --systemd-cgroup exec --process /tmp/runc-process2191655094 --detach --pid-file /run/containerd/io.containerd.runtime.v2.task/k8s.io/024daa4cc70eb683355f6f67beda3012c65d64f479d958e421cd209738a75392/2d56fcb136b07310685c9e188be7a49d32dc0e45a10d3fe14bc550e6ce2aa5cb.pid 024daa4cc70eb683355f6f67beda3012c65d64f479d958e421cd209738a75392 __sys_setuid [{\"int_arg\":0}]"
"2024-02-05T15:23:24.734550826Z null null /usr/local/sbin/runc --root /run/containerd/runc/k8s.io --log /run/containerd/io.containerd.runtime.v2.task/k8s.io/024daa4cc70eb683355f6f67beda3012c65d64f479d958e421cd209738a75392/log.json --log-format json --systemd-cgroup exec --process /tmp/runc-process2191655094 --detach --pid-file /run/containerd/io.containerd.runtime.v2.task/k8s.io/024daa4cc70eb683355f6f67beda3012c65d64f479d958e421cd209738a75392/2d56fcb136b07310685c9e188be7a49d32dc0e45a10d3fe14bc550e6ce2aa5cb.pid 024daa4cc70eb683355f6f67beda3012c65d64f479d958e421cd209738a75392 __sys_setgid [{\"int_arg\":0}]"
"2024-02-05T15:23:28.731719921Z null null /usr/bin/sudo id __sys_setresgid [{\"int_arg\":-1},{\"int_arg\":0},{\"int_arg\":-1}]"
"2024-02-05T15:23:28.731752014Z null null /usr/bin/sudo id __sys_setresuid [{\"int_arg\":-1},{\"int_arg\":0},{\"int_arg\":-1}]"
"2024-02-05T15:23:30.803946368Z null null /usr/bin/sudo id __sys_setgid [{\"int_arg\":0}]"
"2024-02-05T15:23:30.805118893Z null null /usr/bin/sudo id __sys_setresuid [{\"int_arg\":0},{\"int_arg\":0},{\"int_arg\":0}]"
Monitor creation of User namespaces by unprivileged.
User namespaces isolate security-related identifiers like user IDs, group IDs credentials and capabilities. A process can have a normal unprivileged user ID outside a user namespace while at the same time having a privileged user ID 0 (root) inside its own user namespace.
When an unprivileged process creates a new user namespace beside having a
privileged user ID, it will also receive the full set of capabilities. User
namespaces are feature to replace setuid and setgid binaries, and to allow
applications to create sandboxes. However, they expose lot of kernel
interfaces that are normally restricted to privileged (root). Such interfaces
may increase the attack surface and get abused by attackers in order to
perform privileges escalation exploits.
Unfortunatly, a report from Google shows up that 44% of the exploits required unprivileged user namespaces to perform chain privileges escalation. Therfore, detecting the creation of user namespaces by unprivileged is a common best-practice to identify such cases.
The privileges-raise.yaml monitors the creation of user namespaces by unprivileged.
jq 'select(.process_kprobe != null) | select(.process_kprobe.policy_name | test("privileges-raise")) | select(.process_kprobe.function_name | test("create_user_ns")) | "\(.time) \(.process_kprobe.process.pod.namespace) \(.process_kprobe.process.pod.name) \(.process_kprobe.process.binary) \(.process_kprobe.process.arguments) \(.process_kprobe.function_name) \(.process_kprobe.process.process_credentials)"'
"2024-02-05T22:08:15.033035972Z null null /usr/bin/unshare -rUfp create_user_ns {\"uid\":1000,\"gid\":1000,\"euid\":1000,\"egid\":1000,\"suid\":1000,\"sgid\":1000,\"fsuid\":1000,\"fsgid\":1000}"
Monitor execution of the capset() system call.
The capset() system call allows to change the process capabilities.
Detecting capset() calls that set the effective, inheritable and permitted capabilities to non zero is a common best-practice to identify processes that could raise their privileges.
The privileges-raise.yaml
monitors capset() calls that do not drop capabilities.
jq 'select(.process_kprobe != null) | select(.process_kprobe.policy_name | test("privileges-raise")) | select(.process_kprobe.function_name | test("capset")) | "\(.time) \(.process_kprobe.process.pod.namespace) \(.process_kprobe.process.pod.name) \(.process_kprobe.process.binary) \(.process_kprobe.process.arguments) \(.process_kprobe.function_name) \(.process_kprobe.args[3]) \(.process_kprobe.args[1])"'
"2024-02-05T21:12:03.579600653Z null null /usr/bin/sudo id security_capset {\"cap_permitted_arg\":\"000001ffffffffff\"} {\"cap_effective_arg\":\"000001ffffffffff\"}"
"2024-02-05T21:12:04.754115578Z null null /usr/local/sbin/runc --root /run/containerd/runc/k8s.io --log /run/containerd/io.containerd.runtime.v2.task/k8s.io/024daa4cc70eb683355f6f67beda3012c65d64f479d958e421cd209738a75392/log.json --log-format json --systemd-cgroup exec --process /tmp/runc-process2431693392 --detach --pid-file /run/containerd/io.containerd.runtime.v2.task/k8s.io/024daa4cc70eb683355f6f67beda3012c65d64f479d958e421cd209738a75392/9403a57a3061274de26cad41915bad5416d4d484c9e142b22193b74e19a252c5.pid 024daa4cc70eb683355f6f67beda3012c65d64f479d958e421cd209738a75392 security_capset {\"cap_permitted_arg\":\"000001ffffffffff\"} {\"cap_effective_arg\":\"000001ffffffffff\"}"
"2024-02-05T21:12:12.836813445Z null null /usr/bin/runc --root /var/run/docker/runtime-runc/moby --log /run/containerd/io.containerd.runtime.v2.task/moby/c7bc6bf80f07bf6475e507f735866186650137bca2be796d6a39e22b747b97e9/log.json --log-format json --systemd-cgroup create --bundle /run/containerd/io.containerd.runtime.v2.task/moby/c7bc6bf80f07bf6475e507f735866186650137bca2be796d6a39e22b747b97e9 --pid-file /run/containerd/io.containerd.runtime.v2.task/moby/c7bc6bf80f07bf6475e507f735866186650137bca2be796d6a39e22b747b97e9/init.pid c7bc6bf80f07bf6475e507f735866186650137bca2be796d6a39e22b747b97e9 security_capset {\"cap_permitted_arg\":\"00000000a80425fb\"} {\"cap_effective_arg\":\"00000000a80425fb\"}"
"2024-02-05T21:12:14.774175889Z null null /usr/local/sbin/runc --root /run/containerd/runc/k8s.io --log /run/containerd/io.containerd.runtime.v2.task/k8s.io/024daa4cc70eb683355f6f67beda3012c65d64f479d958e421cd209738a75392/log.json --log-format json --systemd-cgroup exec --process /tmp/runc-process2888400204 --detach --pid-file /run/containerd/io.containerd.runtime.v2.task/k8s.io/024daa4cc70eb683355f6f67beda3012c65d64f479d958e421cd209738a75392/d8b8598320fe3d874b901c70863f36233760b3e63650a2474f707cc51b4340f9.pid 024daa4cc70eb683355f6f67beda3012c65d64f479d958e421cd209738a75392 security_capset {\"cap_permitted_arg\":\"000001ffffffffff\"} {\"cap_effective_arg\":\"000001ffffffffff\"}"
Monitor the execution of binaries that exist exclusively as a computer memory-based artifact.
Often attackers execute fileless binaries that reside only in memory rather than on the file system to cover their traces. On Linux this is possible with the help of memfd_create() and shared memory anonymous files. Therefore, detecting execution of such binaries that live only in RAM or backed by volatile storage is a common best-practice.
Tetragon must run with the Process Credentials visibility enabled, please refer to Enable Process Credentials documentation.
No policy needs to be loaded, standard process execution observability is sufficient.
You can use the exec-memfd.py
python script as an example which will copy the binary /bin/true into
an anonymous memory then execute it. The binary will not be linked on the
file system.
jq 'select(.process_exec != null) | select(.process_exec.process.binary_properties != null) | select(.process_exec.process.binary_properties.file) | "\(.time) \(.process_exec.process.pod.namespace) \(.process_exec.process.pod.name) \(.process_exec.process.binary) \(.process_exec.process.arguments) uid=\(.process_exec.process.process_credentials.uid) euid=\(.process_exec.process.process_credentials.euid) binary_properties=\(.process_exec.process.binary_properties)"'
"2024-02-14T15:17:48.758997159Z null null /proc/self/fd/3 null uid=1000 euid=1000 binary_properties={\"file\":{\"inode\":{\"number\":\"45021\",\"links\":0}}}"
The output shows that the executed binary refers to a file descriptor
/proc/self/fd/3 that it is not linked on the file system.
The binary_properties
includes an inode
with zero links on the file system.
Monitor the execution of deleted binaries.
Malicious actors may open a binary, delete it from the file system to hide their traces then execute it. Detecting such executions is a good pratice.
Tetragon must run with the Process Credentials visibility enabled, please refer to Enable Process Credentials documentation.
No policy needs to be loaded, standard process execution observability is sufficient.
jq 'select(.process_exec != null) | select(.process_exec.process.binary_properties != null) | select(.process_exec.process.binary_properties.file != null) | "\(.time) \(.process_exec.process.pod.namespace) \(.process_exec.process.pod.name) \(.process_exec.process.binary) \(.process_exec.process.arguments) uid=\(.process_exec.process.process_credentials.uid) euid=\(.process_exec.process.process_credentials.euid) binary_properties=\(.process_exec.process.binary_properties)"'
"2024-02-14T16:07:54.265540484Z null null /proc/self/fd/14 null uid=1000 euid=1000 binary_properties={\"file\":{\"inode\":{\"number\":\"4991635\",\"links\":0}}}"
The output shows that the executed binary refers to a file descriptor
/proc/self/fd/14 that it is not linked on the file system.
The binary_properties
includes an inode
with zero links on the file system.
Audit BPF program loads and BPFFS interactions
Understanding BPF programs loaded in a cluster and interactions between applications and programs can identify bugs and malicious or unexpected BPF activity.
jq 'select(.process_kprobe != null) | select(.process_kprobe.function_name | test("bpf_check")) | "\(.time) \(.process_kprobe.process.binary) \(.process_kprobe.process.arguments) programType:\(.process_kprobe.args[0].bpf_attr_arg.ProgType) programInsn:\(.process_kprobe.args[0].bpf_attr_arg.InsnCnt)"'
"2023-11-01T02:56:54.926403604Z /usr/bin/bpftool prog list programType:BPF_PROG_TYPE_SOCKET_FILTER programInsn:2"
The security_bpf_map_alloc hook was
renamed to security_bpf_map_create in Linux 6.9.
The example policy already includes both hooks with ignore.callNotFound: true to support both kernels.
Audit loading of kernel modules
Understanding exactly what kernel modules are running in the cluster is crucial to understand attack surface and any malicious actors loading unexpected modules.
jq 'select(.process_kprobe != null) | select(.process_kprobe.function_name | test("security_kernel_module_request")) | "\(.time) \(.process_kprobe.process.binary) \(.process_kprobe.process.arguments) module:\(.process_kprobe.args[0].string_arg)"'
"2023-11-01T04:11:38.390880528Z /sbin/iptables -A OUTPUT -m cgroup --cgroup 1 -j LOG module:ipt_LOG"
Monitor loading of libraries
Understanding the exact versions of shared libraries that binaries load and use is crucial to understand use of vulnerable or deprecated library versions or attacks such as shared library hijacking.
jq 'select(.process_loader != null) | "\(.time) \(.process_loader.process.pod.namespace) \(.process_loader.process.binary) \(.process_loader.process.arguments) \(.process_loader.path)"'
"2023-10-31T19:42:33.065233159Z default/xwing /usr/bin/curl https://ebpf.io /usr/lib/x86_64-linux-gnu/libssl.so.3"
Monitor sessions to SSHd
It is best practice to audit remote connections into a shell server.
jq 'select(.process_kprobe != null) | select(.process_kprobe.function_name | test("tcp_close")) | "\(.time) \(.process_kprobe.process.binary) \(.process_kprobe.process.arguments) \(.process_kprobe.args[0].sock_arg.family) \(.process_kprobe.args[0].sock_arg.type) \(.process_kprobe.args[0].sock_arg.protocol) \(.process_kprobe.args[0].sock_arg.saddr):\(.process_kprobe.args[0].sock_arg.sport)"'
"2023-11-01T04:51:20.109146920Z /usr/sbin/sshd default/xwing AF_INET SOCK_STREAM IPPROTO_TCP 127.0.0.1:22"
Monitor all cluster egress connections
Connections made outside a Kubernetes cluster can be audited to provide insights into any unexpected or malicious reverse shells.
PODCIDR=`kubectl get nodes -o jsonpath='{.items[*].spec.podCIDR}'`
SERVICECIDR=$(gcloud container clusters describe ${NAME} --zone ${ZONE} | awk '/servicesIpv4CidrBlock/ { print $2; }')SERVICECIDR=$(kubectl describe pod -n kube-system kube-apiserver-kind-control-plane | awk -F= '/--service-cluster-ip-range/ {print $2; }')jq 'select(.process_kprobe != null) | select(.process_kprobe.function_name | test("tcp_connect")) | "\(.time) \(.process_kprobe.process.binary) \(.process_kprobe.process.arguments) \(.process_kprobe.args[0].sock_arg.saddr):\(.process_kprobe.args[0].sock_arg.sport) -> \(.process_kprobe.args[0].sock_arg.daddr):\(.process_kprobe.args[0].sock_arg.dport)"'
"2023-11-01T05:25:14.837745007Z /usr/bin/curl http://ebpf.io 10.168.0.45:48272 -> 104.198.14.52:80"
By default, Tetragon monitors process lifecycle, learn more about that in the dedicated use cases.
For more advanced use cases, Tetragon can observe tracepoints and arbitrary
kernel calls via kprobes. For that, Tetragon must be extended and configured
with custom resources objects named TracingPolicy.
It can then generates process_tracepoint and process_kprobes events.
Tetragon observes process creation and termination with default configuration
and generates process_exec and process_exit events:
process_exec events include useful information about the execution of
binaries and related process information. This includes the binary image that
was executed, command-line arguments, the UID context the process was
executed with, the process parent information, the capabilities that a
process had while executed, the process start time, the Kubernetes Pod,
labels and more.process_exit events, as the process_exec event shows how and when a
process started, indicate how and when a process is removed. The information
in the event includes the binary image that was executed, command-line
arguments, the UID context the process was executed with, process parent
information, process start time, the status codes and signals on process
exit. Understanding why a process exited and with what status code helps
understand the specifics of that exit.Both these events include Linux-level metadata (UID, parents, capabilities, start time, etc.) but also Kubernetes-level metadata (Kubernetes namespace, labels, name, etc.). This data make the connection between node-level concepts, the processes, and Kubernetes or container environments.
These events enable a full lifecycle view into a process that can aid an incident investigation, for example, we can determine if a suspicious process is still running in a particular environment. For concrete examples of such events, see the next use case on process execution.
process_exec and process_exitThis first use case is monitoring process execution, which can be observed with
the Tetragon process_exec and process_exit JSON events.
These events contain the full lifecycle of processes, from fork/exec to
exit, including metadata such as:
As a first step, let’s start monitoring the events from the xwing pod:
kubectl logs -n kube-system -l app.kubernetes.io/name=tetragon -c export-stdout -f | tetra getevents -o compact --namespace default --pod xwing
Then in another terminal, let’s kubectl exec into the xwing pod and execute
some example commands:
kubectl exec -it xwing -- /bin/bash
whoami
If you observe, the output in the first terminal should be:
🚀 process default/xwing /bin/bash
🚀 process default/xwing /usr/bin/whoami
💥 exit default/xwing /usr/bin/whoami 0
Here you can see the binary names along with its arguments, the pod info, and return codes in a compact one-line view of the events.
For more details use the raw JSON events to get detailed information, you can stop
the Tetragon CLI by Crl-C and parse the tetragon.log file by executing:
kubectl logs -n kube-system -l app.kubernetes.io/name=tetragon -c export-stdout -f | jq 'select(.process_exec.process.pod.name=="xwing" or .process_exit.process.pod.name=="xwing")'
Example process_exec and process_exit events can be:
{
"process_exec": {
"process": {
"exec_id": "a2luZC1jb250cm9sLXBsYW5lOjExNDI4NjE1NjM2OTAxOjUxNTgz",
"pid": 51583,
"uid": 0,
"cwd": "/",
"binary": "/usr/bin/whoami",
"arguments": "--version",
"flags": "execve rootcwd clone",
"start_time": "2022-05-11T12:54:45.615Z",
"auid": 4294967295,
"pod": {
"namespace": "default",
"name": "xwing",
"container": {
"id": "containerd://1fb931d2f6e5e4cfdbaf30fdb8e2fdd81320bdb3047ded50120a4f82838209ce",
"name": "spaceship",
"image": {
"id": "docker.io/tgraf/netperf@sha256:8e86f744bfea165fd4ce68caa05abc96500f40130b857773186401926af7e9e6",
"name": "docker.io/tgraf/netperf:latest"
},
"start_time": "2022-05-11T10:07:33Z",
"pid": 50
}
},
"docker": "1fb931d2f6e5e4cfdbaf30fdb8e2fdd",
"parent_exec_id": "a2luZC1jb250cm9sLXBsYW5lOjkwNzkyMjU2MjMyNjk6NDM4NzI=",
"refcnt": 1
},
"parent": {
"exec_id": "a2luZC1jb250cm9sLXBsYW5lOjkwNzkyMjU2MjMyNjk6NDM4NzI=",
"pid": 43872,
"uid": 0,
"cwd": "/",
"binary": "/bin/bash",
"flags": "execve rootcwd clone",
"start_time": "2022-05-11T12:15:36.225Z",
"auid": 4294967295,
"pod": {
"namespace": "default",
"name": "xwing",
"container": {
"id": "containerd://1fb931d2f6e5e4cfdbaf30fdb8e2fdd81320bdb3047ded50120a4f82838209ce",
"name": "spaceship",
"image": {
"id": "docker.io/tgraf/netperf@sha256:8e86f744bfea165fd4ce68caa05abc96500f40130b857773186401926af7e9e6",
"name": "docker.io/tgraf/netperf:latest"
},
"start_time": "2022-05-11T10:07:33Z",
"pid": 43
}
},
"docker": "1fb931d2f6e5e4cfdbaf30fdb8e2fdd",
"parent_exec_id": "a2luZC1jb250cm9sLXBsYW5lOjkwNzkxODU5NTMzOTk6NDM4NjE=",
"refcnt": 1
}
},
"node_name": "kind-control-plane",
"time": "2022-05-11T12:54:45.615Z"
}
{
"process_exit": {
"process": {
"exec_id": "a2luZC1jb250cm9sLXBsYW5lOjExNDI4NjE1NjM2OTAxOjUxNTgz",
"pid": 51583,
"uid": 0,
"cwd": "/",
"binary": "/usr/bin/whoami",
"arguments": "--version",
"flags": "execve rootcwd clone",
"start_time": "2022-05-11T12:54:45.615Z",
"auid": 4294967295,
"pod": {
"namespace": "default",
"name": "xwing",
"container": {
"id": "containerd://1fb931d2f6e5e4cfdbaf30fdb8e2fdd81320bdb3047ded50120a4f82838209ce",
"name": "spaceship",
"image": {
"id": "docker.io/tgraf/netperf@sha256:8e86f744bfea165fd4ce68caa05abc96500f40130b857773186401926af7e9e6",
"name": "docker.io/tgraf/netperf:latest"
},
"start_time": "2022-05-11T10:07:33Z",
"pid": 50
}
},
"docker": "1fb931d2f6e5e4cfdbaf30fdb8e2fdd",
"parent_exec_id": "a2luZC1jb250cm9sLXBsYW5lOjkwNzkyMjU2MjMyNjk6NDM4NzI="
},
"parent": {
"exec_id": "a2luZC1jb250cm9sLXBsYW5lOjkwNzkyMjU2MjMyNjk6NDM4NzI=",
"pid": 43872,
"uid": 0,
"cwd": "/",
"binary": "/bin/bash",
"flags": "execve rootcwd clone",
"start_time": "2022-05-11T12:15:36.225Z",
"auid": 4294967295,
"pod": {
"namespace": "default",
"name": "xwing",
"container": {
"id": "containerd://1fb931d2f6e5e4cfdbaf30fdb8e2fdd81320bdb3047ded50120a4f82838209ce",
"name": "spaceship",
"image": {
"id": "docker.io/tgraf/netperf@sha256:8e86f744bfea165fd4ce68caa05abc96500f40130b857773186401926af7e9e6",
"name": "docker.io/tgraf/netperf:latest"
},
"start_time": "2022-05-11T10:07:33Z",
"pid": 43
}
},
"docker": "1fb931d2f6e5e4cfdbaf30fdb8e2fdd",
"parent_exec_id": "a2luZC1jb250cm9sLXBsYW5lOjkwNzkxODU5NTMzOTk6NDM4NjE="
}
},
"node_name": "kind-control-plane",
"time": "2022-05-11T12:54:45.616Z"
}
Advanced process execution can be performed by using Tracing Policies to monitor the execve system call path.
If we want to monitor execution of Executable and Linkable Format (ELF) or flat binaries before they are actually executed. Then the process-exec-elf-begin tracing policy is a good first choice.
The process-exec-elf-begin tracing policy, will not report the different binary format handlers or scripts being executed, but will report the final ELF or flat binary, like the shebang handler.
To report those another tracing policy can be used.
Before going forward, verify that all pods are up and running, ensure you deploy our Demo Application to explore the Security Observability Events:
kubectl create -f https://raw.githubusercontent.com/cilium/cilium/v1.15.3/examples/minikube/http-sw-app.yaml
It might take several seconds for some pods until they satisfy all the dependencies:
kubectl get pods -A
The output should be similar to:
NAMESPACE NAME READY STATUS RESTARTS AGE
default deathstar-54bb8475cc-6c6lc 1/1 Running 0 2m54s
default deathstar-54bb8475cc-zmfkr 1/1 Running 0 2m54s
default tiefighter 1/1 Running 0 2m54s
default xwing 1/1 Running 0 2m54s
kube-system tetragon-sdwv6 2/2 Running 0 27m
Let’s apply the process-exec-elf-begin Tracing Policy.
kubectl apply -f https://raw.githubusercontent.com/cilium/tetragon/main/examples/tracingpolicy/process-exec/process-exec-elf-begin.yaml
Then start monitoring events with the tetra CLI:
kubectl exec -it -n kube-system ds/tetragon -c tetragon -- tetra getevents
In another terminal, kubectl exec into the xwing Pod:
kubectl exec -it xwing -- /bin/bash
And execute some commands:
id
The tetra CLI will generate the following ProcessKprobe events:
{
"process_kprobe": {
"process": {
"exec_id": "a2luZC1jb250cm9sLXBsYW5lOjE2NjY0MDI4MTA4MzcxOjM2NDk5",
"pid": 36499,
"uid": 0,
"cwd": "/",
"binary": "/bin/bash",
"flags": "execve",
"start_time": "2023-08-02T11:58:53.618461573Z",
"auid": 4294967295,
"pod": {
"namespace": "default",
"name": "xwing",
"container": {
"id": "containerd://775beeb1a25a95e10dc149d6eb166bf45dd5e6039e8af3b64e8fb4d29669f349",
"name": "spaceship",
"image": {
"id": "docker.io/tgraf/netperf@sha256:8e86f744bfea165fd4ce68caa05abc96500f40130b857773186401926af7e9e6",
"name": "docker.io/tgraf/netperf:latest"
},
"start_time": "2023-08-02T07:24:54Z",
"pid": 13
},
"pod_labels": {
"app.kubernetes.io/name": "xwing",
"class": "xwing",
"org": "alliance"
}
},
"docker": "775beeb1a25a95e10dc149d6eb166bf",
"parent_exec_id": "a2luZC1jb250cm9sLXBsYW5lOjE2NjYyNzg3ODI1MTQ4OjM2NDkz",
"refcnt": 1,
"tid": 36499
},
"parent": {
"exec_id": "a2luZC1jb250cm9sLXBsYW5lOjE2NjYyNzg3ODI1MTQ4OjM2NDkz",
"pid": 36493,
"uid": 0,
"cwd": "/",
"binary": "/bin/bash",
"flags": "execve rootcwd clone",
"start_time": "2023-08-02T11:58:52.378178852Z",
"auid": 4294967295,
"pod": {
"namespace": "default",
"name": "xwing",
"container": {
"id": "containerd://775beeb1a25a95e10dc149d6eb166bf45dd5e6039e8af3b64e8fb4d29669f349",
"name": "spaceship",
"image": {
"id": "docker.io/tgraf/netperf@sha256:8e86f744bfea165fd4ce68caa05abc96500f40130b857773186401926af7e9e6",
"name": "docker.io/tgraf/netperf:latest"
},
"start_time": "2023-08-02T07:24:54Z",
"pid": 13
},
"pod_labels": {
"app.kubernetes.io/name": "xwing",
"class": "xwing",
"org": "alliance"
}
},
"docker": "775beeb1a25a95e10dc149d6eb166bf",
"parent_exec_id": "a2luZC1jb250cm9sLXBsYW5lOjE2NjYyNzE2OTU0MjgzOjM2NDg0",
"tid": 36493
},
"function_name": "security_bprm_creds_from_file",
"args": [
{
"file_arg": {
"path": "/bin/busybox"
}
}
],
"action": "KPROBE_ACTION_POST"
},
"node_name": "kind-control-plane",
"time": "2023-08-02T11:58:53.624096751Z"
}
In addition to the Kubernetes Identity and process metadata, ProcessKprobe events contain the binary being executed. In the above case they are:
function_name: where we are hooking into the kernel to read the binary that is being executed.file_arg: that includes the path being executed, and here it is /bin/busybox that is the real
binary being executed, since on the xwing pod the container is running busybox.
The binary /usr/bin/id -> /bin/busybox points to busybox.To disable the process-exec-elf-being Tracing Policy run:
kubectl delete -f https://raw.githubusercontent.com/cilium/tetragon/main/examples/tracingpolicy/process-exec/process-exec-elf-begin.yaml
Tetragon also provides the ability to check process capabilities and kernel namespaces access.
This information would help us determine which process or Kubernetes pod has started or gained access to privileges or host namespaces that it should not have. This would help us answer questions like:
Which Kubernetes pods are running with
CAP_SYS_ADMINin my cluster?
Which Kubernetes pods have host network or pid namespace access in my cluster?
Edit the Tetragon configmap:
kubectl edit cm -n kube-system tetragon-config
Set the following flags from “false” to “true”:
# enable-process-cred: true
# enable-process-ns: true
Save your changes and exit.
Restart the Tetragon daemonset:
kubectl rollout restart -n kube-system ds/tetragon
Create a YAML file (e.g., privileged-nginx.yaml) with the following PodSpec:
apiVersion: v1
kind: Pod
metadata:
name: privileged-the-pod
spec:
hostPID: true
hostNetwork: true
containers:
- name: privileged-the-pod
image: nginx:latest
ports:
- containerPort: 80
securityContext:
privileged: true
Apply the configuration:
kubectl apply -f privileged-nginx.yaml
Start monitoring events from the privileged Nginx pod:
kubectl logs -n kube-system -l app.kubernetes.io/name=tetragon -c export-stdout -f | tetra getevents --namespace default --pod privileged-the-pod
You should observe Tetragon generating events similar to these, indicating the privileged container start:
🚀 process default/privileged-nginx /nginx -g daemon off; 🛑 CAP_SYS_ADMIN
Tetragon can monitor Linux namespace operations to detect when processes change
their namespaces. This is particularly useful for detecting container escapes
where a process attempts to access host namespaces using tools like nsenter.
A common container escape technique involves using nsenter to switch into the
host’s namespaces. Even if a container is running with restricted privileges,
monitoring setns syscalls helps detect attempts to break out of the container’s
isolation.
This answers questions like:
Which processes are attempting to change their Linux namespaces?
Is there a container escape attempt happening in my cluster?
Before starting, deploy the Demo Application:
kubectl create -f https://raw.githubusercontent.com/cilium/cilium/v1.15.3/examples/minikube/http-sw-app.yaml
Verify the pods are running:
kubectl get pods -A
The output should be similar to:
NAMESPACE NAME READY STATUS RESTARTS AGE
default deathstar-54bb8475cc-6c6lc 1/1 Running 0 2m54s
default deathstar-54bb8475cc-zmfkr 1/1 Running 0 2m54s
default tiefighter 1/1 Running 0 2m54s
default xwing 1/1 Running 0 2m54s
kube-system tetragon-sdwv6 2/2 Running 0 27m
To monitor namespace access via the setns syscall, we use a TracingPolicy
that hooks into sys_setns (this will be transparently resolved to the
architecture specific symbol, __x64_sys_setns for x86_64 or __arm64_sys_setns
for arm64). This syscall is invoked when a process attempts to change its
namespace.
Create a file named namespace-access.yaml:
apiVersion: cilium.io/v1alpha1
kind: TracingPolicy
metadata:
name: "namespace-access"
spec:
kprobes:
- call: "sys_setns"
syscall: true
args:
- index: 0
type: "int"
- index: 1
type: "int"
Apply the TracingPolicy:
kubectl apply -f namespace-access.yaml
Start monitoring events with the tetra CLI:
kubectl exec -it -n kube-system ds/tetragon -c tetragon -- tetra getevents
In another terminal, simulate a container escape attempt by using nsenter to
enter the host’s namespaces. First, kubectl exec into a pod:
kubectl exec -it xwing -- /bin/bash
Then attempt to enter the host namespaces:
nsenter -t 1 -m -u -n -i -p
The tetra CLI will generate ProcessKprobe
events similar to:
{
"process_kprobe": {
"process": {
"exec_id": "dGV0cmFnb24tZGV2LWNvbnRyb2wtcGxhbmU6MTE2OTc3OTA1NDM0MjAxOjYzMDY2",
"pid": 63066,
"uid": 0,
"cwd": "/",
"binary": "/usr/bin/nsenter",
"arguments": "-t 1 -m -u -n -i -p",
"flags": "execve rootcwd clone",
"start_time": "2026-01-30T18:15:19.985627895Z",
"auid": 4294967295,
"pod": {
"namespace": "default",
"name": "xwing",
"container": {
"id": "containerd://057dc8d712abf96c628c82ea111d53a205a256b0dc39bb31284426aaf378acbc",
"name": "spaceship",
"image": {
"id": "quay.io/cilium/json-mock@sha256:5aad04835eda9025fe4561ad31be77fd55309af8158ca8663a72f6abb78c2603",
"name": "quay.io/cilium/json-mock:latest"
},
"start_time": "2026-01-28T08:51:07Z",
"pid": 37
},
"pod_labels": {
"app.kubernetes.io/name": "xwing",
"class": "xwing",
"org": "alliance"
},
"workload": "xwing",
"workload_kind": "Pod"
},
"docker": "057dc8d712abf96c628c82ea111d53a",
"parent_exec_id": "dGV0cmFnb24tZGV2LWNvbnRyb2wtcGxhbmU6MTE2OTc3NzI5OTA3MzUxOjYzMDUy",
"refcnt": 1,
"tid": 63066
},
"parent": {
"exec_id": "dGV0cmFnb24tZGV2LWNvbnRyb2wtcGxhbmU6MTE2OTc3NzI5OTA3MzUxOjYzMDUy",
"pid": 63052,
"uid": 0,
"cwd": "/",
"binary": "/bin/bash",
"flags": "execve rootcwd clone",
"start_time": "2026-01-30T18:15:19.810100966Z",
"auid": 4294967295,
"pod": {
"namespace": "default",
"name": "xwing",
"container": {
"id": "containerd://057dc8d712abf96c628c82ea111d53a205a256b0dc39bb31284426aaf378acbc",
"name": "spaceship",
"image": {
"id": "quay.io/cilium/json-mock@sha256:5aad04835eda9025fe4561ad31be77fd55309af8158ca8663a72f6abb78c2603",
"name": "quay.io/cilium/json-mock:latest"
},
"start_time": "2026-01-28T08:51:07Z",
"pid": 31
},
"pod_labels": {
"app.kubernetes.io/name": "xwing",
"class": "xwing",
"org": "alliance"
},
"workload": "xwing",
"workload_kind": "Pod"
},
"docker": "057dc8d712abf96c628c82ea111d53a",
"parent_exec_id": "dGV0cmFnb24tZGV2LWNvbnRyb2wtcGxhbmU6ODgzNjQ2NzQwMjg6NzIxMQ==",
"tid": 63052
},
"function_name": "__x64_sys_setns",
"args": [
{
"int_arg": 3
},
{
"int_arg": 134217728
}
],
"action": "KPROBE_ACTION_POST",
"policy_name": "namespace-access",
"return_action": "KPROBE_ACTION_POST"
},
"node_name": "tetragon-dev-control-plane",
"time": "2026-01-30T18:15:20.001042828Z"
}
int_arg: 134217728) corresponds to CLONE_NEWIPC (0x08000000), indicating
an attempt to enter the IPC namespace. Other common values include CLONE_NEWNS (0x20000) for
mount namespace, CLONE_NEWPID (0x20000000) for PID namespace, and CLONE_NEWNET (0x40000000)
for network namespace.To actively prevent namespace escape attempts, you can extend the policy with a
Sigkill action. The following policy will terminate any process that attempts
to call setns from within a container:
apiVersion: cilium.io/v1alpha1
kind: TracingPolicy
metadata:
name: "deny-namespace-access"
spec:
kprobes:
- call: "sys_setns"
syscall: true
args:
- index: 0
type: "int"
- index: 1
type: "int"
selectors:
- matchPIDs:
- operator: NotIn
followForks: true
isNamespacePID: true
values:
- 0
- 1
matchActions:
- action: Sigkill
The matchPIDs selector ensures the policy only applies to container processes:
isNamespacePID: true: Uses the PID namespace ID rather than the host PIDoperator: NotIn with values 0, 1: Excludes the init process (PID 1) and
invalid PIDs, effectively targeting only non-init container processesfollowForks: true: Applies the rule to forked child processes as wellTo remove the TracingPolicy:
kubectl delete -f namespace-access.yaml
This page shows how you can create a tracing policy to monitor filename access. For general information about tracing policies, see the tracing policy page.
There are two aspects of the tracing policy: (i) what hooks you can use to monitor specific types of access, and (ii) how you can filter at the kernel level for only specific events.
There are different ways applications can access and modify files, and for this tracing policy we focus in three different types.
The first is read and write accesses, which is the most common way that applications access files. Applications can perform this type of accesses with a variety of different system
calls: read and write, optimized system calls such as copy_file_range and sendfile, as well
as asynchronous I/O system call families such as the ones provided by aio and io_uring. Instead
of monitoring every system call, we opt to hook into the security_file_permission hook, which is a
common execution point for all the above system calls.
Applications can also access files by mapping them directly into their virtual address space. Since
it is difficult to catch the accesses themselves in this case, our policy will instead monitor the
point when the files are mapped into the application’s virtual memory. To do so, we use the
security_mmap_file hook.
Lastly, there is a family of system calls (e.g,. truncate) that allow to indirectly modify the
contents of the file by changing its size. To catch these types of access we will hook into
security_path_truncate. Note that starting with Linux kernel 6.2, this hook was
refactored
and replaced by security_file_truncate. See the kernel compatibility
note below for details.
Using the hooks above, you can monitor all accesses in the system. However, this will create a large number of events, and it is frequently the case that you are only interested in a specific subset those events. It is possible to filter the events after their generation, but this induces unnecessary overhead. Tetragon, using BPF, allows filtering these events directly in the kernel.
For example, the following snippet shows how you can limit the events from the
security_file_permission hook only for the /etc/passwd file. For this, you need to specify the
arguments of the function that you hooking into, as well as their type.
- call: "security_file_permission"
syscall: false
args:
- index: 0
type: "file" # (struct file *) used for getting the path
- index: 1
type: "int" # 0x04 is MAY_READ, 0x02 is MAY_WRITE
selectors:
- matchArgs:
- index: 0
operator: "Equal"
values:
- "/etc/passwd" # filter by filename (/etc/passwd)
- index: 1
operator: "Equal"
values:
- "2" # filter by type of access (MAY_WRITE)
The previous example uses the Equal operator. Similarly, you can use the Prefix operator to
filter events based on the prefix of a filename.
In this example, we monitor if a process inside a Kubernetes workload performs a read or write in
the /etc/ directory. The policy may be extended with additional directories or specific files if
needed.
As a first step, we apply the following policy that uses the three hooks mentioned previously as well as appropriate filtering:
kubectl apply -f https://raw.githubusercontent.com/cilium/tetragon/main/examples/tracingpolicy/filename_monitoring.yaml
Next, we deploy a file-access Pod with an interactive bash session:
kubectl run --rm -it file-access -n default --image=busybox --restart=Never
In another terminal, you can start monitoring the events from the file-access Pod:
kubectl exec -it -n kube-system ds/tetragon -c tetragon -- tetra getevents -o compact --namespace default --pod file-access
In the interactive bash session, edit the /etc/passwd file:
vi /etc/passwd
If you observe, the output in the second terminal should be:
🚀 process default/file-access /bin/sh
🚀 process default/file-access /bin/vi /etc/passwd
📚 read default/file-access /bin/vi /etc/passwd
📚 read default/file-access /bin/vi /etc/passwd
📚 read default/file-access /bin/vi /etc/passwd
📝 write default/file-access /bin/vi /etc/passwd
📝 truncate default/file-access /bin/vi /etc/passwd
💥 exit default/file-access /bin/vi /etc/passwd 0
Note that read and writes are only generated for /etc/ files based on BPF in-kernel filtering
specified in the policy. The default CRD additionally filters events associated with the pod init
process to filter init noise from pod start.
Similarly to the previous example, reviewing the JSON events provides additional data. An example
process_kprobe event observing a write can be:
{
"process_kprobe": {
"process": {
"exec_id": "dGV0cmFnb24tZGV2LWNvbnRyb2wtcGxhbmU6MTY4MTc3MDUwMTI1NDI6NjQ3NDY=",
"pid": 64746,
"uid": 0,
"cwd": "/",
"binary": "/bin/vi",
"arguments": "/etc/passwd",
"flags": "execve rootcwd clone",
"start_time": "2024-04-14T02:18:02.240856427Z",
"auid": 4294967295,
"pod": {
"namespace": "default",
"name": "file-access",
"container": {
"id": "containerd://6b742e38ee3a212239e6d48b2954435a407af44b9a354bdf540db22f460ab40e",
"name": "file-access",
"image": {
"id": "docker.io/library/busybox@sha256:c3839dd800b9eb7603340509769c43e146a74c63dca3045a8e7dc8ee07e53966",
"name": "docker.io/library/busybox:latest"
},
"start_time": "2024-04-14T02:17:46Z",
"pid": 12
},
"pod_labels": {
"run": "file-access"
},
"workload": "file-access",
"workload_kind": "Pod"
},
"docker": "6b742e38ee3a212239e6d48b2954435",
"parent_exec_id": "dGV0cmFnb24tZGV2LWNvbnRyb2wtcGxhbmU6MTY4MDE3MDQ3OTQyOTg6NjQ2MTU=",
"refcnt": 1,
"tid": 64746
},
"parent": {
"exec_id": "dGV0cmFnb24tZGV2LWNvbnRyb2wtcGxhbmU6MTY4MDE3MDQ3OTQyOTg6NjQ2MTU=",
"pid": 64615,
"uid": 0,
"cwd": "/",
"binary": "/bin/sh",
"flags": "execve rootcwd clone",
"start_time": "2024-04-14T02:17:46.240638141Z",
"auid": 4294967295,
"pod": {
"namespace": "default",
"name": "file-access",
"container": {
"id": "containerd://6b742e38ee3a212239e6d48b2954435a407af44b9a354bdf540db22f460ab40e",
"name": "file-access",
"image": {
"id": "docker.io/library/busybox@sha256:c3839dd800b9eb7603340509769c43e146a74c63dca3045a8e7dc8ee07e53966",
"name": "docker.io/library/busybox:latest"
},
"start_time": "2024-04-14T02:17:46Z",
"pid": 1
},
"pod_labels": {
"run": "file-access"
},
"workload": "file-access",
"workload_kind": "Pod"
},
"docker": "6b742e38ee3a212239e6d48b2954435",
"parent_exec_id": "dGV0cmFnb24tZGV2LWNvbnRyb2wtcGxhbmU6MTY3OTgyOTA2MDc3NTc6NjQ1NjQ=",
"tid": 64615
},
"function_name": "security_file_permission",
"args": [
{
"file_arg": {
"path": "/etc/passwd",
"permission": "-rw-r--r--"
}
},
{
"int_arg": 2
}
],
"return": {
"int_arg": 0
},
"action": "KPROBE_ACTION_POST",
"policy_name": "file-monitoring",
"return_action": "KPROBE_ACTION_POST"
},
"node_name": "tetragon-dev-control-plane",
"time": "2024-04-14T02:18:14.376304204Z"
}
In addition to the Kubernetes Identity
and process metadata from exec events, process_kprobe events contain
the arguments of the observed system call. In the above case they are
file_arg.path: the observed file pathint_arg: is the type of the operation (2 for a write and 4 for a read)return.int_arg: is 0 if the operation is allowedTo disable the TracingPolicy run:
kubectl delete -f https://raw.githubusercontent.com/cilium/tetragon/main/examples/tracingpolicy/filename_monitoring.yaml
To delete the file-access Pod from the interactive bash session, type:
exit
Another example of a similar policy can be found in our examples folder.
The security_path_truncate hook used in the truncation monitoring was
refactored in Linux 6.2
and replaced by security_file_truncate. On kernels >= 6.2, the symbol
security_path_truncate is no longer available as a traceable kprobe entry point,
it may be inlined or its visibility changed. When the tracing policy references
a hook that does not exist in the running kernel, the entire policy fails to
load, which means that no events (including reads and writes from the other
hooks) will be generated.
If you use the example policy
filename_monitoring.yaml
as-is on a newer kernel, it will likely fail to load because it only contains
the old hook. To fix this, you should download the example policy and update it
to either replace security_path_truncate with security_file_truncate, or
add both hooks using the ignore.callNotFound option for maximum compatibility:
# For kernels < 6.2
- call: "security_path_truncate"
# ...
ignore:
callNotFound: true
# For kernels >= 6.2
- call: "security_file_truncate"
syscall: false
return: true
args:
- index: 0
type: "file" # (struct file *) used for getting the path
# ...
ignore:
callNotFound: true
With callNotFound: true, Tetragon will silently skip any hook that is not
present in the running kernel, and still load the rest of the policy
successfully.
You can verify which hook is available on your kernel by running:
# Inside the Tetragon pod (or on the host):
cat /sys/kernel/tracing/available_filter_functions | grep security_path_truncate
cat /sys/kernel/tracing/available_filter_functions | grep security_file_truncate
Note that security_file_truncate takes a struct file * argument (type
"file") instead of struct path * (type "path") used by
security_path_truncate.
Note that this policy has certain limitations because it matches on the filename that the application uses to access. If an application accesses the same file via a hard link or a different bind mount, no event will be generated.
To view TCP connect events, apply the example TCP connect TracingPolicy:
kubectl apply -f https://raw.githubusercontent.com/cilium/tetragon/main/examples/tracingpolicy/tcp-connect.yaml
To start monitoring events in the xwing pod run the Tetragon CLI:
kubectl logs -n kube-system -l app.kubernetes.io/name=tetragon -c export-stdout -f | tetra getevents -o compact --namespace default --pod xwing
In another terminal, start generate a TCP connection. Here we use curl.
kubectl exec -it xwing -- curl http://cilium.io
The output in the first terminal will capture the new connect and write,
🚀 process default/xwing /usr/bin/curl http://cilium.io
🔌 connect default/xwing /usr/bin/curl tcp 10.244.0.6:34965 -> 104.198.14.52:80
📤 sendmsg default/xwing /usr/bin/curl tcp 10.244.0.6:34965 -> 104.198.14.52:80 bytes 73
🧹 close default/xwing /usr/bin/curl tcp 10.244.0.6:34965 -> 104.198.14.52:80
💥 exit default/xwing /usr/bin/curl http://cilium.io 0
To disable the TracingPolicy run:
kubectl delete -f https://raw.githubusercontent.com/cilium/tetragon/main/examples/tracingpolicy/tcp-connect.yaml
On Linux each process has various associated user, group IDs, capabilities, secure management flags, keyring, LSM security that are used part of the security checks upon acting on other objects. These are called the task privileges or process credentials.
Changing the process credentials is a standard operation to perform privileged actions or to execute commands as another user. The obvious example is sudo that allows to gain high privileges and run commands as root or another user. An other example is services or containers that can gain high privileges during execution to perform restricted operations.
execve(2).execve(2), especially when a binary is executed that will execute as
UID 0.These govern the way the UIDs/GIDs and capabilities are manipulated and
inherited over certain operations such as execve(2).
The LSM framework provides a mechanism for various security checks to be hooked by new kernel extensions. Tasks can have extra controls part of LSM on what operations they are allowed to perform.
Monitoring Linux process credentials is a good practice to idenfity programs
running with high privileges. Tetragon allows retrieving Linux process credentials
as a process_credentials object.
Changes to credentials can be monitored either in system calls or in internal kernel functions.
Generally it is better to monitor in internal kernel functions. For further details please read Advantages and disadvantages of kernel layer monitoring compared to the system call layer section.
Tetragon can hook at the system calls that directly manipulate the credentials. This allows us to determine which process is trying to change its credentials and the new credentials that could be applied by the kernel.
This answers the questions:
Which process or container is trying to change its UIDs/GIDs in my cluster?
Which process or container is trying to change its capabilities in my cluster?
Before going forward, verify that all pods are up and running, ensure you deploy our Demo Application to explore the Security Observability Events:
kubectl create -f https://raw.githubusercontent.com/cilium/cilium/v1.15.3/examples/minikube/http-sw-app.yaml
It might take several seconds for some pods until they satisfy all the dependencies:
kubectl get pods -A
NAMESPACE NAME READY STATUS RESTARTS AGE
default deathstar-54bb8475cc-6c6lc 1/1 Running 0 2m54s
default deathstar-54bb8475cc-zmfkr 1/1 Running 0 2m54s
default tiefighter 1/1 Running 0 2m54s
default xwing 1/1 Running 0 2m54s
kube-system tetragon-sdwv6 2/2 Running 0 27m
We use the
process.credentials.changes.at.syscalls
Tracing Policy that hooks the
setuid system calls
family:
setuidsetgidsetfsuidsetfsgidsetreuidsetregidsetresuidsetresgidLet’s apply the process.credentials.changes.at.syscalls Tracing Policy.
kubectl apply -f https://raw.githubusercontent.com/cilium/tetragon/main/examples/tracingpolicy/process-credentials/process.credentials.changes.at.syscalls.yaml
Then start monitoring events with the tetra CLI:
kubectl exec -it -n kube-system ds/tetragon -c tetragon -- tetra getevents
In another terminal, kubectl exec into the xwing Pod:
kubectl exec -it xwing -- /bin/bash
And execute su as this will call the
related setuid system calls:
su root
The tetra CLI will generate the following ProcessKprobe events:
{
"process_kprobe": {
"process": {
"exec_id": "a2luZC1jb250cm9sLXBsYW5lOjQwNzk4ODc2MDI2NTk4OjEyNTc5OA==",
"pid": 125798,
"uid": 0,
"cwd": "/",
"binary": "/bin/su",
"arguments": "root",
"flags": "execve rootcwd clone",
"start_time": "2023-07-05T19:14:30.918693157Z",
"auid": 4294967295,
"pod": {
"namespace": "default",
"name": "xwing",
"container": {
"id": "containerd://55936e548de63f77ceb595d64966dd8e267b391ff0ef63b26c17eb8c2f6510be",
"name": "spaceship",
"image": {
"id": "docker.io/tgraf/netperf@sha256:8e86f744bfea165fd4ce68caa05abc96500f40130b857773186401926af7e9e6",
"name": "docker.io/tgraf/netperf:latest"
},
"start_time": "2023-07-05T18:45:16Z",
"pid": 19
},
"pod_labels": {
"app.kubernetes.io/name": "xwing",
"class": "xwing",
"org": "alliance"
}
},
"docker": "55936e548de63f77ceb595d64966dd8",
"parent_exec_id": "a2luZC1jb250cm9sLXBsYW5lOjQwNzk1NjYyMDM3MzMyOjEyNTc5Mg==",
"refcnt": 1,
"tid": 125798
},
"parent": {
"exec_id": "a2luZC1jb250cm9sLXBsYW5lOjQwNzk1NjYyMDM3MzMyOjEyNTc5Mg==",
"pid": 125792,
"uid": 0,
"cwd": "/",
"binary": "/bin/bash",
"flags": "execve rootcwd clone",
"start_time": "2023-07-05T19:14:27.704703805Z",
"auid": 4294967295,
"pod": {
"namespace": "default",
"name": "xwing",
"container": {
"id": "containerd://55936e548de63f77ceb595d64966dd8e267b391ff0ef63b26c17eb8c2f6510be",
"name": "spaceship",
"image": {
"id": "docker.io/tgraf/netperf@sha256:8e86f744bfea165fd4ce68caa05abc96500f40130b857773186401926af7e9e6",
"name": "docker.io/tgraf/netperf:latest"
},
"start_time": "2023-07-05T18:45:16Z",
"pid": 13
},
"pod_labels": {
"app.kubernetes.io/name": "xwing",
"class": "xwing",
"org": "alliance"
}
},
"docker": "55936e548de63f77ceb595d64966dd8",
"parent_exec_id": "a2luZC1jb250cm9sLXBsYW5lOjQwNzk1NjE2MTU0NzA2OjEyNTc4Mw==",
"refcnt": 2,
"tid": 125792
},
"function_name": "__x64_sys_setgid",
"args": [
{
"int_arg": 0
}
],
"action": "KPROBE_ACTION_POST"
},
"node_name": "kind-control-plane",
"time": "2023-07-05T19:14:30.918977160Z"
}
{
"process_kprobe": {
"process": {
"exec_id": "a2luZC1jb250cm9sLXBsYW5lOjQwNzk4ODc2MDI2NTk4OjEyNTc5OA==",
"pid": 125798,
"uid": 0,
"cwd": "/",
"binary": "/bin/su",
"arguments": "root",
"flags": "execve rootcwd clone",
"start_time": "2023-07-05T19:14:30.918693157Z",
"auid": 4294967295,
"pod": {
"namespace": "default",
"name": "xwing",
"container": {
"id": "containerd://55936e548de63f77ceb595d64966dd8e267b391ff0ef63b26c17eb8c2f6510be",
"name": "spaceship",
"image": {
"id": "docker.io/tgraf/netperf@sha256:8e86f744bfea165fd4ce68caa05abc96500f40130b857773186401926af7e9e6",
"name": "docker.io/tgraf/netperf:latest"
},
"start_time": "2023-07-05T18:45:16Z",
"pid": 19
},
"pod_labels": {
"app.kubernetes.io/name": "xwing",
"class": "xwing",
"org": "alliance"
}
},
"docker": "55936e548de63f77ceb595d64966dd8",
"parent_exec_id": "a2luZC1jb250cm9sLXBsYW5lOjQwNzk1NjYyMDM3MzMyOjEyNTc5Mg==",
"refcnt": 1,
"tid": 125798
},
"parent": {
"exec_id": "a2luZC1jb250cm9sLXBsYW5lOjQwNzk1NjYyMDM3MzMyOjEyNTc5Mg==",
"pid": 125792,
"uid": 0,
"cwd": "/",
"binary": "/bin/bash",
"flags": "execve rootcwd clone",
"start_time": "2023-07-05T19:14:27.704703805Z",
"auid": 4294967295,
"pod": {
"namespace": "default",
"name": "xwing",
"container": {
"id": "containerd://55936e548de63f77ceb595d64966dd8e267b391ff0ef63b26c17eb8c2f6510be",
"name": "spaceship",
"image": {
"id": "docker.io/tgraf/netperf@sha256:8e86f744bfea165fd4ce68caa05abc96500f40130b857773186401926af7e9e6",
"name": "docker.io/tgraf/netperf:latest"
},
"start_time": "2023-07-05T18:45:16Z",
"pid": 13
},
"pod_labels": {
"app.kubernetes.io/name": "xwing",
"class": "xwing",
"org": "alliance"
}
},
"docker": "55936e548de63f77ceb595d64966dd8",
"parent_exec_id": "a2luZC1jb250cm9sLXBsYW5lOjQwNzk1NjE2MTU0NzA2OjEyNTc4Mw==",
"refcnt": 2,
"tid": 125792
},
"function_name": "__x64_sys_setuid",
"args": [
{
"int_arg": 0
}
],
"action": "KPROBE_ACTION_POST"
},
"node_name": "kind-control-plane",
"time": "2023-07-05T19:14:30.918990583Z"
}
In addition to the Kubernetes Identity and process metadata from exec events, ProcessKprobe events contain the arguments of the observed system call. In the above case they are:
function_name: the system call, __x64_sys_setuid or
__x64_sys_setgidint_arg: the uid or gid to use, in our case it’s 0 which corresponds to
the root user.To disable the process.credentials.changes.at.syscalls Tracing Policy run:
kubectl delete -f https://raw.githubusercontent.com/cilium/tetragon/main/examples/tracingpolicy/process-credentials/process.credentials.changes.at.syscalls.yaml
Monitoring Process Credentials changes at the kernel layer is also possible.
This allows to capture the new process_credentials that should be applied.
This process-creds-installed tracing policy can be used to answer the following questions:
Which process or container is trying to change its own UIDs/GIDs in the cluster?
Which process or container is trying to change its own capabilities in the cluster?
In which user namespace the credentials are being changed?
How to monitor
process_credentialschanges?
The main advantages of monitoring at the kernel layer compared to the system call layer:
Not vulnerable to user space arguments tampering.
Ability to display the full new credentials to be applied.
It is more reliable since it has full context on where and how the new credentials should be applied including the user namespace.
A catch all layer for all system calls, and every normal kernel path that manipulate credentials.
One potential disadvantage is that this approach may generate a lot of events, so appropriate filtering must be applied to reduce the noise.
First, verify that your k8s environment is all setup and that all pods are up and running, and deploy the Demo Application:
kubectl create -f https://raw.githubusercontent.com/cilium/cilium/v1.15.3/examples/minikube/http-sw-app.yaml
It might take several seconds until all pods are Running:
kubectl get pods -A
NAMESPACE NAME READY STATUS RESTARTS AGE
default deathstar-54bb8475cc-6c6lc 1/1 Running 0 2m54s
default deathstar-54bb8475cc-zmfkr 1/1 Running 0 2m54s
default tiefighter 1/1 Running 0 2m54s
default xwing 1/1 Running 0 2m54s
kube-system tetragon-sdwv6 2/2 Running 0 27m
We use the process-creds-installed Tracing Policy that hooks the kernel layer when credentials are being installed.
So let’s apply the process-creds-installed Tracing Policy.
kubectl apply -f https://raw.githubusercontent.com/cilium/tetragon/main/examples/tracingpolicy/process-credentials/process-creds-installed.yaml
Then we start monitoring for events with tetra cli:
kubectl exec -it -n kube-system ds/tetragon -c tetragon -- tetra getevents
In another terminal, inside a pod and as a non root user we will execute a setuid binary (suid):
/tmp/su -
The tetra cli will generate the following ProcessKprobe events:
{
"process_kprobe": {
"process": {
"exec_id": "a2luZC1jb250cm9sLXBsYW5lOjE0MDczMDQyODk3MTc6MjIzODY=",
"pid": 22386,
"uid": 11,
"cwd": "/",
"binary": "/tmp/su",
"arguments": "-",
"flags": "execve rootcwd clone",
"start_time": "2023-07-25T12:04:59.359333454Z",
"auid": 4294967295,
"pod": {
"namespace": "default",
"name": "xwing",
"container": {
"id": "containerd://2e58c8357465961fd96f758e87d0269dfb5f97c536847485de9d7ec62be34a64",
"name": "spaceship",
"image": {
"id": "docker.io/tgraf/netperf@sha256:8e86f744bfea165fd4ce68caa05abc96500f40130b857773186401926af7e9e6",
"name": "docker.io/tgraf/netperf:latest"
},
"start_time": "2023-07-25T11:44:48Z",
"pid": 43
},
"pod_labels": {
"app.kubernetes.io/name": "xwing",
"class": "xwing",
"org": "alliance"
}
},
"docker": "2e58c8357465961fd96f758e87d0269",
"parent_exec_id": "a2luZC1jb250cm9sLXBsYW5lOjEzOTU0MDY5OTA1ODc6MjIzNTI=",
"refcnt": 1,
"tid": 22386
},
"parent": {
"exec_id": "a2luZC1jb250cm9sLXBsYW5lOjEzOTU0MDY5OTA1ODc6MjIzNTI=",
"pid": 22352,
"uid": 11,
"cwd": "/",
"binary": "/bin/sh",
"flags": "execve rootcwd",
"start_time": "2023-07-25T12:04:47.462035587Z",
"auid": 4294967295,
"pod": {
"namespace": "default",
"name": "xwing",
"container": {
"id": "containerd://2e58c8357465961fd96f758e87d0269dfb5f97c536847485de9d7ec62be34a64",
"name": "spaceship",
"image": {
"id": "docker.io/tgraf/netperf@sha256:8e86f744bfea165fd4ce68caa05abc96500f40130b857773186401926af7e9e6",
"name": "docker.io/tgraf/netperf:latest"
},
"start_time": "2023-07-25T11:44:48Z",
"pid": 41
},
"pod_labels": {
"app.kubernetes.io/name": "xwing",
"class": "xwing",
"org": "alliance"
}
},
"docker": "2e58c8357465961fd96f758e87d0269",
"parent_exec_id": "a2luZC1jb250cm9sLXBsYW5lOjEzOTU0MDQ3NzY5NzI6MjIzNTI=",
"refcnt": 2,
"tid": 22352
},
"function_name": "commit_creds",
"args": [
{
"process_credentials_arg": {
"uid": 0,
"gid": 0,
"euid": 0,
"egid": 0,
"suid": 0,
"sgid": 0,
"fsuid": 0,
"fsgid": 0,
"caps": {
"permitted": [
"CAP_CHOWN",
"DAC_OVERRIDE",
"CAP_FOWNER",
"CAP_FSETID",
"CAP_KILL",
"CAP_SETGID",
"CAP_SETUID",
"CAP_SETPCAP",
"CAP_NET_BIND_SERVICE",
"CAP_NET_RAW",
"CAP_SYS_CHROOT",
"CAP_MKNOD",
"CAP_AUDIT_WRITE",
"CAP_SETFCAP"
],
"effective": [
"CAP_CHOWN",
"DAC_OVERRIDE",
"CAP_FOWNER",
"CAP_FSETID",
"CAP_KILL",
"CAP_SETGID",
"CAP_SETUID",
"CAP_SETPCAP",
"CAP_NET_BIND_SERVICE",
"CAP_NET_RAW",
"CAP_SYS_CHROOT",
"CAP_MKNOD",
"CAP_AUDIT_WRITE",
"CAP_SETFCAP"
]
},
"user_ns": {
"level": 0,
"uid": 0,
"gid": 0,
"ns": {
"inum": 4026531837,
"is_host": true
}
}
}
}
],
"action": "KPROBE_ACTION_POST"
},
"node_name": "kind-control-plane",
"time": "2023-07-25T12:05:01.410834172Z"
}
In addition to the Kubernetes Identity and process metadata from exec events, ProcessKprobe events contain the arguments of the observed system call. In the above case they are:
function_name: the kernel commit_creds() function to install new credentials.process_credentials_arg: the new process_credentials to be installed
on the current process. It includes the UIDs/GIDs, the capabilities and the target user namespace.Here we can clearly see that the suid binary is being executed by a user ID 11 in order to elevate its privileges to user ID 0 including capabilities.
To disable the process-creds-installed Tracing Policy run:
kubectl delete -f https://raw.githubusercontent.com/cilium/tetragon/main/examples/tracingpolicy/process-credentials/process-creds-installed.yaml
Some pods need to change the host system or kernel parameters in order to perform administrative tasks, obvious examples are pods loading a kernel module to extend the operating system functionality, or pods managing the network.
However, there are also other cases where a compromised container may want to load a kernel module to hide its behaviour.
In this aspect, monitoring such host system changes helps to identify pods and containers that affect the host system.
A kernel module is a code that can be loaded into the kernel image at runtime, without rebooting. These modules, which can be loaded by pods and containers, can modify the host system. The Monitor Linux kernel modules guide will assist you in observing such events.
Monitoring kernel modules helps to identify processes that load kernel modules to add features, to the operating system, to alter host system functionality or even hide their behaviour. This can be used to answer the following questions:
Which process or container is changing the kernel?
Which process or container is loading or unloading kernel modules in the cuslter?
Which process or container requested a feature that triggered the kernel to automatically load a module?
Are the loaded kernel modules signed?
After deploying Tetragon, use the monitor-kernel-modules tracing policy which generates ProcessKprobe events to trace kernel module operations.
Apply the monitor-kernel-modules tracing policy:
kubectl apply -f https://raw.githubusercontent.com/cilium/tetragon/main/examples/tracingpolicy/host-changes/monitor-kernel-modules.yaml
Then start monitoring for events with tetra CLI:
kubectl exec -it -n kube-system ds/tetragon -c tetragon -- tetra getevents
When loading an out of tree module named kernel_module_hello.ko with the command insmod,
tetra CLI will generate the following ProcessKprobe events:
{
"process_kprobe": {
"process": {
"exec_id": "OjEzMTg4MTQwNDUwODkwOjgyMDIz",
"pid": 82023,
"uid": 0,
"cwd": "/home/tixxdz/tetragon",
"binary": "/usr/sbin/insmod",
"arguments": "contrib/tester-progs/kernel_module_hello.ko",
"flags": "execve clone",
"start_time": "2023-08-30T11:01:22.846516679Z",
"auid": 1000,
"parent_exec_id": "OjEzMTg4MTM4MjY2ODQyOjgyMDIy",
"refcnt": 1,
"tid": 82023
},
"parent": {
"exec_id": "OjEzMTg4MTM4MjY2ODQyOjgyMDIy",
"pid": 82022,
"uid": 1000,
"cwd": "/home/tixxdz/tetragon",
"binary": "/usr/bin/sudo",
"arguments": "insmod contrib/tester-progs/kernel_module_hello.ko",
"flags": "execve",
"start_time": "2023-08-30T11:01:22.844332959Z",
"auid": 1000,
"parent_exec_id": "OjEzMTg1NTE3MTgzNDM0OjgyMDIx",
"refcnt": 1,
"tid": 0
},
"function_name": "security_kernel_read_file",
"args": [
{
"file_arg": {
"path": "/home/tixxdz/tetragon/contrib/tester-progs/kernel_module_hello.ko"
}
},
{
"int_arg": 2
}
],
"return": {
"int_arg": 0
},
"action": "KPROBE_ACTION_POST"
},
"time": "2023-08-30T11:01:22.847554295Z"
}
In addition to the process metadata from exec events, ProcessKprobe events contain the arguments of the observed call. In the above case they are:
security_kernel_read_file: the kernel security hook when the kernel loads file specified by user space.file_arg: the full path of the kernel module on the file system.{
"process_kprobe": {
"process": {
"exec_id": "OjEzMTg4MTQwNDUwODkwOjgyMDIz",
"pid": 82023,
"uid": 0,
"cwd": "/home/tixxdz/tetragon",
"binary": "/usr/sbin/insmod",
"arguments": "contrib/tester-progs/kernel_module_hello.ko",
"flags": "execve clone",
"start_time": "2023-08-30T11:01:22.846516679Z",
"auid": 1000,
"parent_exec_id": "OjEzMTg4MTM4MjY2ODQyOjgyMDIy",
"refcnt": 1,
"tid": 82023
},
"parent": {
"exec_id": "OjEzMTg4MTM4MjY2ODQyOjgyMDIy",
"pid": 82022,
"uid": 1000,
"cwd": "/home/tixxdz/tetragon",
"binary": "/usr/bin/sudo",
"arguments": "insmod contrib/tester-progs/kernel_module_hello.ko",
"flags": "execve",
"start_time": "2023-08-30T11:01:22.844332959Z",
"auid": 1000,
"parent_exec_id": "OjEzMTg1NTE3MTgzNDM0OjgyMDIx",
"refcnt": 1,
"tid": 0
},
"function_name": "do_init_module",
"args": [
{
"module_arg": {
"name": "kernel_module_hello",
"tainted": [
"TAINT_OUT_OF_TREE_MODULE",
"TAINT_UNSIGNED_MODULE"
]
}
}
],
"action": "KPROBE_ACTION_POST"
},
"time": "2023-08-30T11:01:22.847638990Z"
}
This ProcessKprobe event contains:
do_init_module: the function call where the module is finaly loaded.module_arg: the kernel module information, it contains:name: the name of the kernel module as a string.tainted: the module tainted flags that will be applied on the kernel. In the example above, it indicates we are loading an out-of-tree module, that is unsigned module which may compromise the integrity of our system.Kernels compiled with CONFIG_MODULE_SIG option will check if the modules being loaded were cryptographically signed.
This allows to assert that:
If the module being loaded is signed, the kernel has its key and the signature verification succeeded.
The integrity of the system or the kernel was not compromised.
After deploying Tetragon, use the monitor-signed-kernel-modules tracing policy which generates ProcessKprobe events to identify if kernel modules are signed or not.
Apply the monitor-signed-kernel-modules tracing policy:
kubectl apply -f https://raw.githubusercontent.com/cilium/tetragon/main/examples/tracingpolicy/host-changes/monitor-signed-kernel-modules.yaml
Before going forward, deploy the test-pod into the demo-app namespace, which has its security context set to privileged.
This allows to run the demo by mountig an xfs file system inside the test-pod which requires privileges,
but will also trigger an automatic xfs module loading operation.
kubectl create namespace demo-app
kubectl apply -n demo-app -f https://raw.githubusercontent.com/cilium/tetragon/main/testdata/specs/testpod.yaml
Start monitoring for events with tetra CLI:
kubectl exec -it -n kube-system ds/tetragon -c tetragon -- tetra getevents
In another terminal, kubectl exec into the test-pod and run the following commands to create an xfs filesystem:
kubectl exec -it -n demo-app test-pod -- /bin/sh
apk update
dd if=/dev/zero of=loop.xfs bs=1 count=0 seek=32M
ls -lha loop.xfs
apk add xfsprogs
mkfs.xfs -q loop.xfs
mkdir /mnt/xfs.volume
mount -o loop -t xfs loop.xfs /mnt/xfs.volume/
losetup -a | grep xfs
Now the xfs filesystem should be mounted at /mnt/xfs.volume. To unmount it and release the loop device run:
umount /mnt/xfs.volume/
tetra CLI will generate the following events:
First the mount command will trigger an automatic operation to load the xfs kernel module.
{
"process_kprobe": {
"process": {
"exec_id": "a2luZC1jb250cm9sLXBsYW5lOjQxMjc1NTA0OTk5NTcyOjEzMDg3Ng==",
"pid": 130876,
"uid": 0,
"cwd": "/",
"binary": "/bin/mount",
"arguments": "-o loop -t xfs loop.xfs /mnt/xfs.volume/",
"flags": "execve rootcwd clone",
"start_time": "2023-09-09T23:27:42.732039059Z",
"auid": 4294967295,
"pod": {
"namespace": "demo-app",
"name": "test-pod",
"container": {
"id": "containerd://1e910d5cc8d8d68c894934170b162ef93aea5652867ed6bd7c620c7e3f9a10f1",
"name": "test-pod",
"image": {
"id": "docker.io/cilium/starwars@sha256:f92c8cd25372bac56f55111469fe9862bf682385a4227645f5af155eee7f58d9",
"name": "docker.io/cilium/starwars:latest"
},
"start_time": "2023-09-09T22:46:09Z",
"pid": 45672
},
"workload": "test-pod"
},
"docker": "1e910d5cc8d8d68c894934170b162ef",
"parent_exec_id": "a2luZC1jb250cm9sLXBsYW5lOjQxMjYyOTc1MjI1MDkzOjEzMDgwOQ==",
"refcnt": 1,
"tid": 130876
},
"parent": {
"exec_id": "a2luZC1jb250cm9sLXBsYW5lOjQxMjYyOTc1MjI1MDkzOjEzMDgwOQ==",
"pid": 130809,
"uid": 0,
"cwd": "/",
"binary": "/bin/sh",
"flags": "execve rootcwd clone",
"start_time": "2023-09-09T23:27:30.202263472Z",
"auid": 4294967295,
"pod": {
"namespace": "demo-app",
"name": "test-pod",
"container": {
"id": "containerd://1e910d5cc8d8d68c894934170b162ef93aea5652867ed6bd7c620c7e3f9a10f1",
"name": "test-pod",
"image": {
"id": "docker.io/cilium/starwars@sha256:f92c8cd25372bac56f55111469fe9862bf682385a4227645f5af155eee7f58d9",
"name": "docker.io/cilium/starwars:latest"
},
"start_time": "2023-09-09T22:46:09Z",
"pid": 45612
},
"workload": "test-pod"
},
"docker": "1e910d5cc8d8d68c894934170b162ef",
"parent_exec_id": "a2luZC1jb250cm9sLXBsYW5lOjQxMjYyOTEwMjM3OTQ2OjEzMDgwMA==",
"tid": 130809
},
"function_name": "security_kernel_module_request",
"args": [
{
"string_arg": "fs-xfs"
}
],
"return": {
"int_arg": 0
},
"action": "KPROBE_ACTION_POST"
},
"node_name": "kind-control-plane",
"time": "2023-09-09T23:27:42.751151233Z"
}
In addition to the process metadata from exec events, ProcessKprobe event contains the arguments of the observed call. In the above case they are:
security_kernel_module_request: the kernel security hook where modules are loaded on-demand.string_arg: the name of the kernel module. When modules are automatically loaded, for security reasons,
the kernel prefixes the module with the name of the subsystem that requested it. In our case, it’s requested
by the file system subsystem, hence the name is fs-xfs.The kernel will then call user space modprobe to load the kernel module.
{
"process_exec": {
"process": {
"exec_id": "a2luZC1jb250cm9sLXBsYW5lOjQxMjc1NTI0MjYzMjIxOjEzMDg3Nw==",
"pid": 130877,
"uid": 0,
"cwd": "/",
"binary": "/sbin/modprobe",
"arguments": "-q -- fs-xfs",
"flags": "execve rootcwd clone",
"start_time": "2023-09-09T23:27:42.751301124Z",
"auid": 4294967295,
"parent_exec_id": "a2luZC1jb250cm9sLXBsYW5lOjE6MA==",
"tid": 130877
},
"parent": {
"exec_id": "a2luZC1jb250cm9sLXBsYW5lOjE6MA==",
"pid": 0,
"uid": 0,
"binary": "<kernel>",
"flags": "procFS",
"start_time": "2023-09-09T11:59:47.227037763Z",
"auid": 0,
"parent_exec_id": "a2luZC1jb250cm9sLXBsYW5lOjE6MA==",
"tid": 0
}
},
"node_name": "kind-control-plane",
"time": "2023-09-09T23:27:42.751300984Z"
}
The ProcessExec event where modprobe tries to load the xfs module.
modprobe is started in the initial Linux host namespaces, outside of the container namespaces. When kernel
modules are loaded on-demand, the kernel will spawn a user space process modprobe that finds and load the appropriate
module from the host file system. This is done on behalf of the container and since its originate from the kernel then
the inherited Linux namespaces including the file system are eventually from the host.modprobe will read the passed xfs kernel module from the host file system.
{
"process_kprobe": {
"process": {
"exec_id": "a2luZC1jb250cm9sLXBsYW5lOjQxMjc1NTI0MjYzMjIxOjEzMDg3Nw==",
"pid": 130877,
"uid": 0,
"cwd": "/",
"binary": "/sbin/modprobe",
"arguments": "-q -- fs-xfs",
"flags": "execve rootcwd clone",
"start_time": "2023-09-09T23:27:42.751301124Z",
"auid": 4294967295,
"parent_exec_id": "a2luZC1jb250cm9sLXBsYW5lOjE6MA==",
"refcnt": 1,
"tid": 130877
},
"parent": {
"exec_id": "a2luZC1jb250cm9sLXBsYW5lOjE6MA==",
"pid": 0,
"uid": 0,
"binary": "<kernel>",
"flags": "procFS",
"start_time": "2023-09-09T11:59:47.227037763Z",
"auid": 0,
"parent_exec_id": "a2luZC1jb250cm9sLXBsYW5lOjE6MA==",
"tid": 0
},
"function_name": "security_kernel_read_file",
"args": [
{
"file_arg": {
"path": "/usr/lib/modules/6.2.0-32-generic/kernel/fs/xfs/xfs.ko"
}
},
{
"int_arg": 2
}
],
"return": {
"int_arg": 0
},
"action": "KPROBE_ACTION_POST"
},
"node_name": "kind-control-plane",
"time": "2023-09-09T23:27:42.752425825Z"
}
This ProcessKprobe event contains:
security_kernel_read_file: the kernel security hook when the kernel loads file specified by user space.file_arg: the full path of the kernel module on the host file system.The final event is when the kernel is parsing the module sections. If all succeed the module will be loaded.
{
"process_kprobe": {
"process": {
"exec_id": "a2luZC1jb250cm9sLXBsYW5lOjQxMjc1NTI0MjYzMjIxOjEzMDg3Nw==",
"pid": 130877,
"uid": 0,
"cwd": "/",
"binary": "/sbin/modprobe",
"arguments": "-q -- fs-xfs",
"flags": "execve rootcwd clone",
"start_time": "2023-09-09T23:27:42.751301124Z",
"auid": 4294967295,
"parent_exec_id": "a2luZC1jb250cm9sLXBsYW5lOjE6MA==",
"refcnt": 1,
"tid": 130877
},
"parent": {
"exec_id": "a2luZC1jb250cm9sLXBsYW5lOjE6MA==",
"pid": 0,
"uid": 0,
"binary": "<kernel>",
"flags": "procFS",
"start_time": "2023-09-09T11:59:47.227037763Z",
"auid": 0,
"parent_exec_id": "a2luZC1jb250cm9sLXBsYW5lOjE6MA==",
"tid": 0
},
"function_name": "find_module_sections",
"args": [
{
"module_arg": {
"name": "xfs",
"signature_ok": true
}
}
],
"action": "KPROBE_ACTION_POST"
},
"node_name": "kind-control-plane",
"time": "2023-09-09T23:27:42.760880332Z"
}
This ProcessKprobe event contains the module argument.
find_module_sections: the function call where the kernel parses the module sections.module_arg: the kernel module information, it contains:name: the name of the kernel module as a string.signature_ok: a boolean value, if set to true then module signature was successfully verified by the kernel. If it is false
or missing then the signature verification was not performed or probably failed. In all cases this means the integrity of the system has been compromised. Depends on kernels compiled with CONFIG_MODULE_SIG option.Using the same monitor-kernel-modules tracing policy allows to monitor unloading of kernel modules.
The following ProcessKprobe event will be generated:
{
"process_kprobe": {
"process": {
"exec_id": "OjMzNzQ4NzY1MDAyNDk5OjI0OTE3NQ==",
"pid": 249175,
"uid": 0,
"cwd": "/home/tixxdz/tetragon",
"binary": "/usr/sbin/rmmod",
"arguments": "kernel_module_hello",
"flags": "execve clone",
"start_time": "2023-08-30T16:44:03.471068355Z",
"auid": 1000,
"parent_exec_id": "OjMzNzQ4NzY0MjQ4MTY5OjI0OTE3NA==",
"refcnt": 1,
"tid": 249175
},
"parent": {
"exec_id": "OjMzNzQ4NzY0MjQ4MTY5OjI0OTE3NA==",
"pid": 249174,
"uid": 1000,
"cwd": "/home/tixxdz/tetragon",
"binary": "/usr/bin/sudo",
"arguments": "rmmod kernel_module_hello",
"flags": "execve",
"start_time": "2023-08-30T16:44:03.470314558Z",
"auid": 1000,
"parent_exec_id": "OjMzNzQ2MjA5OTUxODI4OjI0OTE3Mw==",
"refcnt": 1,
"tid": 0
},
"function_name": "free_module",
"args": [
{
"module_arg": {
"name": "kernel_module_hello",
"tainted": [
"TAINT_OUT_OF_TREE_MODULE",
"TAINT_UNSIGNED_MODULE"
]
}
}
],
"action": "KPROBE_ACTION_POST"
},
"time": "2023-08-30T16:44:03.471984676Z"
}
To disable the monitor-kernel-modules run:
kubectl delete -f https://raw.githubusercontent.com/cilium/tetragon/main/examples/tracingpolicy/host-changes/monitor-kernel-modules.yaml
Tetragon is able to observe various security events and even enforce security policies.
The Record Linux Capabilities Usage guide shows how to monitor and record Capabilities checks conducted by the kernel on behalf of applications during privileged operations. This can be used to inspect and produce security profiles for pods and containers.
When the kernel needs to perform a privileged operation on behalf of a process, it checks the Capabilities of the process and issues a verdict to allow or deny the operation.
Tetragon is able to record these checks performed by the kernel. This can be used to answer the following questions:
What is the capabilities profile of pods or containters running in the cluster?
What capabilities to add or remove when configuring a security context for a pod or container?
First, verify that your k8s environment is set up and that all pods are up and running, and deploy the demo application:
kubectl create -f https://raw.githubusercontent.com/cilium/cilium/v1.15.3/examples/minikube/http-sw-app.yaml
It might take several seconds until all pods are Running:
kubectl get pods -A
The output should be similar to:
NAMESPACE NAME READY STATUS RESTARTS AGE
default deathstar-54bb8475cc-6c6lc 1/1 Running 0 2m54s
default deathstar-54bb8475cc-zmfkr 1/1 Running 0 2m54s
default tiefighter 1/1 Running 0 2m54s
default xwing 1/1 Running 0 2m54s
kube-system tetragon-sdwv6 2/2 Running 0 27m
We use the creds-capability-usage tracing policy which generates ProcessKprobe events.
Tracing policies as the one used here, may emit a high number of events.
To reduce events, the creds-capability-usage rate limits events to 1 minute. More details about rate-limiting can be found in the tracing policy documentation.
Apply the creds-capability-usage policy:
kubectl apply -f https://raw.githubusercontent.com/cilium/tetragon/main/examples/tracingpolicy/process-credentials/creds-capability-usage.yaml
Start monitoring for events with tetra cli, but match only events of xwing pod:
kubectl exec -it -n kube-system ds/tetragon -c tetragon -- tetra getevents --namespaces default --pods xwing
In another terminal, kubectl exec into the xwing pod:
kubectl exec -it xwing -- /bin/bash
As an example execute dmesg to print the kernel ring buffer. This requires the special capability CAP_SYSLOG:
dmesg
The output should be similar to:
dmesg: klogctl: Operation not permitted
The tetra cli will generate the following ProcessKprobe events:
{
"process_kprobe": {
"process": {
"exec_id": "a2luZC1jb250cm9sLXBsYW5lOjEyODQyNzgzMzUwNjg0OjczODYw",
"pid": 73860,
"uid": 0,
"cwd": "/",
"binary": "/bin/dmesg",
"flags": "execve rootcwd clone",
"start_time": "2023-07-06T10:13:33.834390020Z",
"auid": 4294967295,
"pod": {
"namespace": "default",
"name": "xwing",
"container": {
"id": "containerd://cfb961400ff25811d22d139a10f6a62efef53c2ecc11af47bc911a7f9a2ac1f7",
"name": "spaceship",
"image": {
"id": "docker.io/tgraf/netperf@sha256:8e86f744bfea165fd4ce68caa05abc96500f40130b857773186401926af7e9e6",
"name": "docker.io/tgraf/netperf:latest"
},
"start_time": "2023-07-06T08:07:30Z",
"pid": 171
},
"pod_labels": {
"app.kubernetes.io/name": "xwing",
"class": "xwing",
"org": "alliance"
}
},
"docker": "cfb961400ff25811d22d139a10f6a62",
"parent_exec_id": "a2luZC1jb250cm9sLXBsYW5lOjEyODQyMTI3MTIwOTcyOjczODUw",
"refcnt": 1,
"ns": {
"uts": {
"inum": 4026534655
},
"ipc": {
"inum": 4026534656
},
"mnt": {
"inum": 4026534731
},
"pid": {
"inum": 4026534732
},
"pid_for_children": {
"inum": 4026534732
},
"net": {
"inum": 4026534512
},
"time": {
"inum": 4026531834,
"is_host": true
},
"time_for_children": {
"inum": 4026531834,
"is_host": true
},
"cgroup": {
"inum": 4026534733
},
"user": {
"inum": 4026531837,
"is_host": true
}
},
"tid": 73860
},
"parent": {
"exec_id": "a2luZC1jb250cm9sLXBsYW5lOjEyODQyMTI3MTIwOTcyOjczODUw",
"pid": 73850,
"uid": 0,
"cwd": "/",
"binary": "/bin/bash",
"flags": "execve rootcwd clone",
"start_time": "2023-07-06T10:13:33.178160018Z",
"auid": 4294967295,
"pod": {
"namespace": "default",
"name": "xwing",
"container": {
"id": "containerd://cfb961400ff25811d22d139a10f6a62efef53c2ecc11af47bc911a7f9a2ac1f7",
"name": "spaceship",
"image": {
"id": "docker.io/tgraf/netperf@sha256:8e86f744bfea165fd4ce68caa05abc96500f40130b857773186401926af7e9e6",
"name": "docker.io/tgraf/netperf:latest"
},
"start_time": "2023-07-06T08:07:30Z",
"pid": 165
},
"pod_labels": {
"app.kubernetes.io/name": "xwing",
"class": "xwing",
"org": "alliance"
}
},
"docker": "cfb961400ff25811d22d139a10f6a62",
"parent_exec_id": "a2luZC1jb250cm9sLXBsYW5lOjEyODQyMDgxNTA3MzUzOjczODQx",
"refcnt": 2,
"tid": 73850
},
"function_name": "cap_capable",
"args": [
{
"user_ns_arg": {
"level": 0,
"uid": 0,
"gid": 0,
"ns": {
"inum": 4026531837,
"is_host": true
}
}
},
{
"capability_arg": {
"value": 34,
"name": "CAP_SYSLOG"
}
}
],
"return": {
"int_arg": -1
},
"action": "KPROBE_ACTION_POST"
},
"node_name": "kind-control-plane",
"time": "2023-07-06T10:13:33.834882128Z"
}
In addition to the Kubernetes Identity and process metadata from exec events, ProcessKprobe events contain the arguments of the observed system call. In the above case they are:
function_name: that is the cap_capable kernel function.
user_ns_arg: is the user namespace where the capability is required.
level: is the nested level of the user namespace. Here it is zero which indicates the initial user namespace.uid: is the user ID of the owner of the user namespace.gid: is the group ID of the owner of the user namespace.ns: details the information about the namespace. is_host indicates that the target user namespace where the capability is required is the host namespace.capability_arg: is the capability required to perform the operation. In this example reading the kernel ring buffer.
value: is the integer number of the required capability.name: is the name of the required capability. Here it is the CAP_SYSLOG.return: indicates via the int_arg if the capability check succeeded or failed. 0 means it succeeded and the access was granted while -1 means it failed and the operation was denied.
To disable the creds-capability-usage run:
kubectl delete -f https://raw.githubusercontent.com/cilium/tetragon/main/examples/tracingpolicy/process-credentials/creds-capability-usage.yaml
Welcome to Tetragon :) !
We’re happy you’re interested in contributing to the Tetragon project.
While this document focuses on the technical details of how to submit patches to the Tetragon project, we value all kinds of contributions.
For example, actions that can greatly improve Tetragon and contribute to its success could be:
This section of the Tetragon documentation will help you make sure you have an environment capable of testing changes to the Tetragon source code, and that you understand the workflow of getting these changes reviewed and merged upstream.
Make sure you have a GitHub account.
Fork the Tetragon repository to your GitHub user or organization. The repository is available under github.com/cilium/tetragon.
(Optional) Turn off GitHub actions for your fork. This is recommended to avoid unnecessary CI notification failures on the fork.
Clone your fork
and set up the base repository as upstream remote:
git clone https://github.com/${YOUR_GITHUB_USERNAME_OR_ORG}/tetragon.git
cd tetragon
git remote add upstream https://github.com/cilium/tetragon.git
Prepare your development setup.
Check out GitHub good first issues to find something to work on. If this is your first Tetragon issue, try to start with something small that you think you can do without too much external help. Also avoid assigning too many issues to yourself (see Don’t Lick the Cookie!).
Follow the steps in making changes to start contributing.
Learn how to run the tests or how to preview and contribute to the docs.
Learn how to submit a pull request to the project.
Please accept our gratitude for taking the time to improve Tetragon! :)
For local development, you will likely want to build and run bare-metal Tetragon.
go.mod;libcap and libelf (in Debian systems, e.g., install
libelf-dev and libcap-dev).You can build most Tetragon targets as follows (this can take time as it builds all the targets needed for testing, see minimal build):
make
If you want to use podman instead of docker, you can do the following (assuming you
need to use sudo with podman):
CONTAINER_ENGINE='sudo podman' make
You can ignore /bin/sh: docker: command not found in the output.
To build using the local clang, you can use:
CONTAINER_ENGINE='sudo podman' LOCAL_CLANG=1 LOCAL_CLANG_FORMAT=1 make
See Dockerfile.clang
for the minimal required version of clang.
To build the tetragon binary, the BPF programs and the tetra CLI binary you
can use:
make tetragon tetragon-bpf tetra
You should now have a ./tetragon binary, which can be run as follows:
sudo ./tetragon --bpf-lib bpf/objs
Notes:
The --bpf-lib flag tells Tetragon where to look for its compiled BPF
programs (which were built in the make step above).
If Tetragon fails with an error "BTF discovery: candidate btf file does not exist", then make sure that your kernel support BTF,
otherwise place a BTF file where Tetragon can read it and specify its path
with the --btf flag. See more about that
in the FAQ.
The base kernel should support BTF
or a BTF file should be bind mounted on top of /var/lib/tetragon/btf inside
container.
To build Tetragon image:
make image
To run the image:
docker run --name tetragon \
--rm -it -d --pid=host \
--cgroupns=host --privileged \
-v /sys/kernel/btf/vmlinux:/var/lib/tetragon/btf \
cilium/tetragon:latest
Run the tetra binary to get Tetragon events:
docker exec -it tetragon \
bash -c "/usr/bin/tetra getevents -o compact"
To build Tetragon tarball:
make tarball
This command will setup tetragon, kind cluster and install tetragon in it. Ensure docker, kind, kubectl, and helm are installed.
# Setup tetragon on kind
make kind-setup
Verify that Tetragon is installed by running:
kubectl get pods -n tetragon
Building the nok8s version of tetragon relies on setting the nok8s tag in builds. This means that
editor or IDE would need to be configured appropriately so that features such as “goto-definition”
operate in the full build.
You can find some configuration examples below.
For neovim lsp, you can use:
vim.lsp.config.gopls = {
cmd = { "gopls" },
cmd_env = {GOFLAGS = "-tags=nok8s"}
}
For fatih/vim-go, you can use:
let g:go_build_tags = 'nok8s'
There is also the :GoBuildTags convenience command to change or remove build
tags.
Use Lima to create a Linux VM if you are using a Mac with Apple silicon. For example:
~/.lima/tetragon/lima.yaml if you prefer to only
mount Tetragon directory as writable.First create a VM using Lima:
brew install lima
limactl create --mount-writable --tty=false --name=tetragon
limactl start tetragon
limactl shell tetragon
Then install needed dependencies inside the VM:
sudo add-apt-repository -y ppa:longsleep/golang-backports
sudo apt update
sudo apt install -y golang-1.23 libelf-dev libcap-dev make
export CONTAINER_ENGINE=nerdctl
export PATH=$PATH:/usr/lib/go-1.23/bin
You can now build Tetragon in your VM:
make -j3 tetragon-bpf tetragon tetra
Make sure the main branch of your fork is up-to-date:
git fetch upstream
git checkout main
git merge upstream/main
For further reference read GitHub syncing a fork documentation.
Create a PR branch with a descriptive name, branching from main:
git switch -c pr/${GITHUB_USERNAME_OR_ORG}/changes-to-something main
Make the changes you want.
Test your changes. Follow Development setup and Running tests guides to build and test Tetragon.
Run code/docs generation commands if needed (see the sections below for specific code areas).
Run git diff --check to catch obvious white space violations.
Follow Submitting a pull request guide to commit your changes and open a pull request.
To improve Tetragon documentation (https://tetragon.io/), please follow the documentation contribution guide.
Tetragon vendors Go dependencies. If you add a new Go dependency (go.mod), run:
make vendor
Most dependencies are updated automatically using Renovate. If this is not the desired behavior, you will need to
update the Renovate configuration (.github/renovate.json5).
Tetragon contains a protobuf API and uses code generation based on protoc to generate large amounts of boilerplate
code. Whenever you make changes to these files (api/) you need to run code generation:
make protogen
Should you wish to modify any of the resulting codegen files (ending in .pb.go), do not modify them directly.
Instead, you can edit the files in tools/protoc-gen-go-tetragon/ and then re-run make protogen.
Kubernetes Custom Resource Definitions (CRDs) are defined using Kubebuilder framework and shipped with generated Go
client and helpers code. They are also included in the Helm chart for easy installation. Whenever you make changes to
these files (pkg/k8s/), you need to run code generation:
make crds
If you make changes to the Helm values (install/kubernetes/tetragon/values.yaml), you need to update the generated
Helm values reference:
make -C install/kubernetes docs
If you add, change or delete metrics, you need to update the generated metrics reference:
make metrics-docs
Tetragon has several types of tests:
Those tests are running in the Tetragon CI on various kernels1 and various architectures (amd64 and arm64).
To run the Go tests locally, you can use:
make test
Use EXTRA_TESTFLAGS to add flags to the go test command.
To run the Go tests on various kernel versions, we use vmtests with cilium/little-vm-helper in the CI, you can also use it locally for testing specific kernels. See documentation github.com/cilium/tetragon/tests/vmtests.
To run BPF unit tests, you can use:
make bpf-test
Those tests can be found under
github.com/cilium/tetragon/bpf/tests.
The framework uses Go tests with cilium/ebpf to run those tests, you can use
BPFGOTESTFLAGS to add go test flags, like make BPFGOTESTFLAGS="-v" bpf-test.
To run E2E tests, you can use:
make e2e-test
This will build the Tetragon image and use the e2e framework to create a kind
cluster, install Tetragon and run the tests. To not rebuild the image before
running the test, use E2E_BUILD_IMAGES=0. You can use EXTRA_TESTFLAGS to
add flags to the go test command.
For the detailed list, search for jobs.test.strategy.matrix.kernel in
github.com/cilium/tetragon/.github/workflows/vmtests.yml ↩︎
Thank you for taking the time to improve Tetragon’s documentation.
All the Tetragon documentation content can be found under github.com/cilium/tetragon/docs/content/en/docs.
_index.md. For example
/docs/contribution-guide is available
under /docs/content/en/docs/contribution-guide/_index.md.We generally follow the Kubernetes docs style guide k8s.io/docs/contribute/style/style-guide.
To preview the documentation locally, use one of the method below. Then browse to localhost:1313/docs, the default port used by Hugo to listen.
With a Docker service available, from the root of the repository, use:
make docs
You can also use make from the Makefile at the /docs folder level.
To cleanup the container image built in the process, you can use:
make -C docs clean
The documentation is a Hugo static website using the Docsy theme.
Please refer to dedicated guides on how to install Hugo+extended and how to
tweak Docsy, but generally, to preview your work, from the /docs folder:
hugo server
Save your changes in one or more commits. If you are not comfortable
with Git yet (in particular with git rebase), refer to the
GitHub documentation.
Commits should separate logical chunks of code and not represent a chronological list of changes. Each commit should compiles and is functional on its own to allow for bisecting.
If in code review you are requested to make changes, squash the follow-up changes into the existing commits.
All commits must contain a well-written commit message:
Write a title, no longer than 72 characters. The title should ideally
answer the question “what?”. If the commit covers one specific area, start
the title with a prefix like helm:, bpf:, pkg/sensors:, or metrics:.
Describe the changes in the commit description. Focus on answering the
question why the change is required and document anything that might be
unexpected. If any explanation is required to understand your code, then it
should be written in the code comments instead of the commit description.
Please wrap your commit description to ~70/80 chars width lines (use
gq in vim for example).
Add a Fixes: #XXX line if the commit addresses a particular GitHub issue
identified by its number. Note that the GitHub issue will be automatically
closed when the commit is merged.
If any of the commits fixes a particular commit already in the tree,
that commit is referenced in the commit message of the bugfix. The
proper format for the Fixes: tag referring to commits is to use the
first 12 characters of the git SHA followed by the full commit title as
seen above without breaking the line.
Fixes: 29b76c402b68 ("Refactor CRD defaulting and validation as generic")
All commits must be signed off (git commit -s).
See the section Developer’s Certificate of Origin.
tetragon: Fix struct perf_event_info_type layout
We have a hole in perf_event_info_type which results in wrong number in
its go counterpart MsgGenericKprobePerfEvent which is aligned differently.
Make sure the C object does not have any holes.
Fixes: #4119
Signed-off-by: Jiri Olsa <jolsa@kernel.org>
Commit can contain previous output of commands, and the result after the patch to explicit the benefit to the reviewer, it can also be logs output, benchmark results, etc.
cmd/tetra: use text/tabwriter to format tp list output
Also add the support of load error by reusing the metric state recap.
Previously, the output of `tetra tp list` was a bit chaotic, for
example, with 2 policies, with one with a loading error, it looked like
the following:
[1] invalid enabled:false filterID:0 namespace:(global) sensors:
loadError: "policy handler 'tracing' failed loading policy 'invalid': tracing [...]
[2] block-binary enabled:true filterID:0 namespace:(global) sensors:gkp-sensor-1
Now, using text/tabwriter, we redact the errors (use -o json for full
output) and put everything in columns:
ID NAME STATE FILTERID NAMESPACE SENSORS
1 invalid load_error 0 (global)
2 block-binary enabled 0 (global) gkp-sensor-1
Signed-off-by: Mahe Tardy <mahe.tardy@gmail.com>
Commit message can contain the Reported-by, Suggested-by, etc., tags from
the kernel documentation.
You can also use the Co-authored-by tag
to create commits with multiple authors.
bpf: fix tail call program types for usdt sensor
As reported by Mahe newest kernels check properly on programs using
(some) maps being same type[^1]. We violate that with usdt tail called
programs having just 'uprobe' type.
[^1]: 4540aed51b12 ("bpf: Enforce expected_attach_type for tailcall compatibility")
Reported-by: Mahe Tardy <mahe.tardy@gmail.com>
Signed-off-by: Jiri Olsa <jolsa@kernel.org>
Include a Fixes: tag and try to explain a bug you found out.
pkg/crdutils: fix standalone custom resources validation
This fixes commit 29b76c4 ("Refactor CRD defaulting and validation
as generic") that was enhancing commit a9c9a0b ("pkg/tracingpolicy:
add k8s validation for meta and spec").
I think it's a typo that was introduced because when we do the validation
of the object, we give the function two versions of that object, cr that
is typed and was created by yaml.UnmarshalStrict the JSON object with
K8s default, and unstr that is the unstructured object version of what
was passed as input, but with K8s default. We need these two objects to
do the validation respectively on the ObjectMeta and the Spec.
When Unmarshaling the JSON object to the GenericTracingPolicy (or
others) types, all fields are set to their Golang defaults (!) in
addition to the K8s default that were already applied. So some missing
fields, that were defaulted by the K8s default were injected in the
process and thus only partial validation was done.
Fixes: 29b76c402b68 ("Refactor CRD defaulting and validation as generic")
Signed-off-by: Mahe Tardy <mahe.tardy@gmail.com>
Contributions must be submitted in the form of pull requests against the upstream GitHub repository at https://github.com/cilium/tetragon.
Please follow the checklist in the pull request template and write anything that reviewers should be aware of in the pull request description. After you create a pull request, a reviewer will be automatically assigned. They will provide feedback, add relevant labels and run the CI workflows if needed.
Document any user-facing or breaking changes in contrib/upgrade-notes/latest.md.
Verify the release note text. If not explicitly changed, the title of the PR will be used for the release notes. If you want to change this, you can add a special section to the description of the PR. These release notes are primarily going to be read by users, so it is important that release notes for bugs, major and minor features do not contain internal details of Cilium functionality which sometimes are irrelevant for users.
Example of a bad release note
```release-note
Fix concurrent access in k8s watchers structures
```
Example of a good release note
```release-note
Fix panic when Tetragon received an invalid Tracing Policy from Kubernetes
```
If you have permissions to do so, pick the right release-note label. These labels will be used to generate the release notes which will primarily be read by users.
| Labels | When to set |
|---|---|
| release-note/bug | This is a non-trivial bugfix and is a user-facing bug |
| release-note/major | This is a major feature addition, e.g. Add MongoDB support |
| release-note/minor | This is a minor feature addition, e.g. Add support for a Kubernetes version |
| release-note/misc | This is a not user-facing change, e.g. Refactor endpoint package, a bug fix of a non-released feature |
| release-note/docs | This is a documentation change. |
| release-note/ci | This is a CI feature or bug fix. |
You can run make vendor then add and commit your changes.
You need to add a signed-off-by line to your commit messages. The easiest way
to do this is with git fetch origin/main && git rebase --signoff origin/main.
Then push your changes.
To improve tracking of who did what, we’ve introduced a “sign-off” procedure, make sure to read and apply the Developer’s Certificate of Origin.
Tetragon release notes are published on the GitHub releases page. To ensure the release notes are accurate and helpful, contributors should write them alongside development. Then, at the time of release, the final notes are compiled and published.
This guide is intended for both Tetragon developers and reviewers. Please follow it when creating or reviewing pull requests.
release-note blurb in PRWhen you create a pull request, the template will include a release-note blurb in the description. Write a short
description of your change there. Focus on the user perspective - that is, what functionality is available, not how
it’s implemented.
The release-note blurb will be compiled into the release notes as a bullet point. If you delete the release-note
blurb from the PR description, then the PR title will be used instead (it’s reasonable to do so for example when the
change has no user impact).
release-note/* labelEach pull request should have exactly one release-note/* label. The label will be added by a reviewer, but feel free
to suggest one when you create a PR.
The following release-note/* labels are available:
release-note/major - use it for changes you want to be highlighted in the release. Typically these are new
features, but the question to answer is always if it’s a highlight of the release, not how big or new the change is.release-note/minor - use it for other user-visible changes, for example improving an existing functionality or
adding a new config optionrelease-note/bug - use it for bug fixesrelease-note/misc - use it for changes that don’t have any user impact, for example refactoring or testsrelease-note/ci - use it for CI-only changes (.github directory)release-note/docs - use it for documentation-only changes (docs directory)release-note/dependency - use it for PRs that only update dependencies. This label is added automatically to PRs
created by Renovate bot and is rarely used by humans.Upgrade notes highlight changes that require attention when upgrading Tetragon. They instruct users on how to adapt in case the change requires a manual intervention.
Examples of changes that should be covered in upgrade notes:
If your change entails an upgrade note, write it in the contrib/upgrade-notes/latest.md file (if your change doesn’t
fit nicely in the predefined sections, just add a note at the top). The upgrade notes will be included in the release,
in addition to the regular release notes.
Tetragon is a sub-project of the Cilium project and follows the same governance model, community processes, and contributor growth paths as Cilium. To support contributors in gaining both privileges and responsibilities, we adopt the shared Contributor Ladder. This contributor ladder defines how contributors can grow from community participants to project maintainers, along with the expectations at each level.
Community members generally start at the first levels of the ladder and advance as their involvement deepens. Becoming a Cilium organization member grants additional privileges across the project ecosystem, such as the ability to review pull requests or trigger CI runs. If you are contributing regularly to Tetragon, we encourage you to join the Tetragon Reviewers team to help review code and accelerate development.
Your contributions play a vital role in improving the project, and the community is here to support you every step of the way.
Tetragon default controlling settings are set during compilation, so configuration is only needed when it is necessary to deviate from those defaults. This document lists those controlling settings and how they can be set as a CLI arguments or as configuration options from YAML files.
The following table list all Tetragon daemon available options and is
automatically generated using the tetragon binary --generate-docs flag. The
same information can also be retrieved using --help.
| Flag | Usage | Default Value |
|---|---|---|
--bpf-dir | Set tetragon bpf directory (default 'tetragon') | tetragon |
--bpf-lib | Location of Tetragon libs (btf and bpf files) | /var/lib/tetragon/ |
--btf | Location of btf | |
--cgroup-rate | Base sensor events cgroup rate <events,interval> disabled by default ('1000,1s' means rate 1000 events per second) | |
--cluster-name | Name of the cluster where Tetragon is installed | |
--config-dir | Configuration directory that contains a file for each option | |
--cpuprofile | Store CPU profile into provided file | |
--cri-endpoint | CRI endpoint | |
--data-cache-size | Size of the data events cache | 1024 |
--debug | Enable debug messages. Equivalent to '--log-level=debug' | false |
--deleted-pod-cache-size | Size of the deleted pod cache | 1024 |
--disable-kprobe-multi | Allow to disable kprobe multi interface | false |
--enable-ancestors | Comma-separated list of process event types to enable ancestors for. Supported event types are: base, kprobe, tracepoint, loader, uprobe, lsm, usdt. Unknown event types will be ignored. Type 'base' enables ancestors for process_exec and process_exit events and is required by all other supported event types for correct reference counting. An empty string disables ancestors completely | [] |
--enable-cgidmap | enable pod resolution via cgroup ids | false |
--enable-cgidmap-debug | enable cgidmap debugging info | false |
--enable-cgtrackerid | enable cgroup tracker id (only used if 'enable-cgidmap' is set) | true |
--enable-cri | enable CRI client for tetragon | false |
--enable-deprecated-tracingpolicy-grpc | Enable deprecated gRPC TracingPolicy APIs | false |
--enable-event-metrics | Enable per-event metrics. Enabled by default. Health and resource metrics are always available when --metrics-server is set. | true |
--enable-export-aggregation | Enable JSON export aggregation | false |
--enable-k8s-api | Access Kubernetes API to associate Tetragon events with Kubernetes pods | false |
--enable-msg-handling-latency | Enable metrics for message handling latency | false |
--enable-pid-set-filter | Enable pidSet export filters. Not recommended for production use | false |
--enable-pod-annotations | Add pod annotations field to events. | false |
--enable-pod-info | Enable PodInfo custom resource | false |
--enable-policy-filter | Enable policy filter code | false |
--enable-policy-filter-cgroup-map | Enable cgroup mappings for policy filter maps | false |
--enable-policy-filter-debug | Enable policy filter debug messages | false |
--enable-process-cred | Enable process_cred events | false |
--enable-process-environment-variables | Include environment variables in process_exec events. Disabled by default. Note that this option can significantly increase the size of the events and may impact performance, as well as capture sensitive information such as passwords in the events (you can use --redaction-filters to redact the data). | false |
--enable-process-ns | Enable namespace information in process_exec and process_kprobe events | false |
--enable-tracing-policy-crd | Enable TracingPolicy and TracingPolicyNamespaced custom resources | true |
--event-cache-retries | Number of retries for event cache | 15 |
--event-cache-retry-delay | Delay in seconds between event cache retries | 2 |
--event-queue-size | Set the size of the internal event queue. | 10000 |
--execve-map-entries | Set entries for execve_map table (default 32768) | 0 |
--execve-map-size | Set size for execve_map table (allows K/M/G suffix) | |
--export-aggregation-buffer-size | Aggregator channel buffer size | 10000 |
--export-aggregation-window-size | JSON export aggregation time window | 15s |
--export-allowlist | JSON export allowlist | |
--export-denylist | JSON export denylist | |
--export-file-compress | Compress rotated JSON export files | false |
--export-file-max-backups | Number of rotated JSON export files to retain | 5 |
--export-file-max-size-mb | Size in MB for rotating JSON export files | 10 |
--export-file-perm | Access permissions on JSON export files | 600 |
--export-file-rotation-interval | Interval at which to rotate JSON export files in addition to rotating them by size | 0s |
--export-filename | Filename for JSON export. Disabled by default | |
--export-rate-limit | Rate limit (per minute) for event export. Set to -1 to disable | -1 |
--expose-stack-addresses | Expose real linear addresses in events stack traces | false |
--field-filters | Field filters for event exports | |
--filter-environment-variables | Filter for specific environment variables | [] |
--force-large-progs | Force loading large programs, even in kernels with < 5.3 versions | false |
--force-small-progs | Force loading small programs, even in kernels with >= 5.3 versions | false |
--generate-docs | Generate documentation in YAML format to stdout | false |
--gops-address | gops server address (e.g. 'localhost:8118'). Disabled by default | |
--health-server-address | Health server address (e.g. ':6789')(use '' to disabled it) | :6789 |
--health-server-interval | Health server interval in seconds | 10 |
--help | help for tetragon | false |
--k8s-controlplane-retry | Number of attempts for Kubernetes control plane connection (negative for infinite, zero is invalid, positive for max attempts) | 1 |
--k8s-kubeconfig-path | Absolute path of the kubernetes kubeconfig file | |
--keep-sensors-on-exit | Do not unload sensors on exit | false |
--kernel | Kernel version | |
--log-file | Set log file where tetragon agent logs will be written (in addition to stdout or stderr) | |
--log-format | Set log format | text |
--log-level | Set log level | info |
--memprofile | Store MEM profile into provided file | |
--metrics-label-filter | Comma-separated list of enabled metrics labels. Unknown labels will be ignored. | namespace,workload,pod,binary |
--metrics-server | Metrics server address (e.g. ':2112'). Disabled by default | |
--netns-dir | Network namespace dir | /var/run/docker/netns/ |
--parents-map-enabled | Enable parents_map for matchParentBinaries selector | false |
--parents-map-entries | Set entries for parents_map table (default 32768) | 0 |
--parents-map-size | Set size for parents_map table (allows K/M/G suffix) | |
--persist-grpc-policies | Persist tracing policies installed over gRPC across agent restarts | false |
--persist-grpc-policies-dir | Directory in which to persist tracing policies installed over gRPC | /var/run/tetragon/grpc-policies |
--pprof-address | Serves runtime profile data via HTTP (e.g. 'localhost:6060'). Disabled by default | |
--process-cache-gc-interval | Time between checking the process cache for old entries | 30s |
--process-cache-size | Size of the process cache | 65536 |
--procfs | Location of procfs to consume existing PIDs | /proc/ |
--rb-queue-size | Set size of channel between ring buffer and sensor go routines (default 65k, allows K/M/G suffix) | 65535 |
--rb-size | Set ring buffer size for single cpu (default 65k, allows K/M/G suffix) | 0 |
--rb-size-total | Set ring buffer size in total for all cpus (default 65k per cpu, allows K/M/G suffix) | 0 |
--redaction-filters | Redaction filters for events | |
--release-pinned-bpf | Release all pinned BPF programs and maps in Tetragon BPF directory. Enabled by default. Set to false to disable | true |
--retprobes-cache-size | Set {k,u}retprobes events cache maximum size | 4096 |
--server-address | gRPC server address (e.g. 'localhost:54321' or 'unix:///var/run/tetragon/tetragon.sock'). An empty address disables the gRPC server | localhost:54321 |
--server-tls-cert-file | Path to a PEM-encoded server certificate. When set, TLS is enabled on the TCP gRPC listener. | |
--server-tls-client-ca-files | Paths to PEM-encoded CA bundles used to verify client certificates. Required when --server-tls-require-client-cert is true. | [] |
--server-tls-key-file | Path to the PEM-encoded private key matching --server-tls-cert-file. Required when --server-tls-cert-file is set. | |
--server-tls-require-client-cert | Require and verify client certificates (mTLS). Requires --server-tls-client-ca-files. | false |
--sleepable-preload-size | Set the maximum number of entries in the sleepable preload map | 32768 |
--tracing-policy | Tracing policy file to load at startup | |
--tracing-policy-dir | Directory from where to load Tracing Policies | /etc/tetragon/tetragon.tp.d |
--use-perf-ring-buffer | Use the perf ring buffer instead of the bpf ring buffer | false |
--username-metadata | Resolve UIDs to user names for processes running in host namespace | disabled |
--verbose | set verbosity level for eBPF verifier dumps. Pass 0 for silent, 1 for truncated logs, 2 for a full dump | 0 |
Tetragon controlling settings can also be loaded from YAML configuration files according to this order:
From the drop-in configuration snippets inside the following directories where each filename maps to one controlling setting and the content of the file to its corresponding value:
/usr/lib/tetragon/tetragon.conf.d/*/usr/local/lib/tetragon/tetragon.conf.d/*From the configuration file /etc/tetragon/tetragon.yaml if available,
overriding previous settings.
From the drop-in configuration snippets inside
/etc/tetragon/tetragon.conf.d/*, similarly overriding previous settings.
If the config-dir setting is set, Tetragon loads its settings from the
files inside the directory pointed by this option, overriding previous
controlling settings. The config-dir is also part of Kubernetes
ConfigMap.
When reading configuration from directories, each filename maps to one controlling setting. If the same controlling setting is set multiple times, then the last value or content of that file overrides the previous ones.
To summarize the configuration precedence:
Drop-in directory pointed by --config-dir.
Drop-in directory /etc/tetragon/tetragon.conf.d/*.
Configuration file /etc/tetragon/tetragon.yaml.
Drop-in directories:
/usr/local/lib/tetragon/tetragon.conf.d/*/usr/lib/tetragon/tetragon.conf.d/*To clear a controlling setting that was set before, set it again to an empty value.
Package managers can customize the configuration by installing drop-ins under
/usr/. Configurations in /etc/tetragon/ are strictly reserved for the local
administrator, who may use this logic to override package managers or the
default installed configuration.
The examples/configuration/tetragon.yaml
file contains example entries showing the defaults as a guide to the
administrator. Local overrides can be created by editing and copying this file
into /etc/tetragon/tetragon.yaml, or by editing and copying “drop-ins” from
the examples/configuration/tetragon.conf.d
directory into the /etc/tetragon/tetragon.conf.d/ subdirectory. The latter is
generally recommended.
Each filename maps to a one controlling setting and the content of the file to its corresponding value. This is the recommended way.
Changing configuration example:
/etc/tetragon/tetragon.conf.d/bpf-lib with a corresponding value of:
/var/lib/tetragon/
/etc/tetragon/tetragon.conf.d/log-format with a corresponding value of:
text
/etc/tetragon/tetragon.conf.d/export-filename with a corresponding value of:
/var/log/tetragon/tetragon.log
/etc/tetragon/tetragon.yaml
and all drop-ins under /etc/tetragon/tetragon.conf.d/The gRPC API supports unix sockets, it can be set using one of the following methods:
Use the --server-address flag:
--server-address unix:///var/run/tetragon/tetragon.sock
Or use the drop-in configuration file /etc/tetragon/tetragon.conf.d/server-address containing:
unix:///var/run/tetragon/tetragon.sock
Then to access the gRPC API with tetra client, set --server-address to point to the corresponding address:
sudo tetra --server-address unix:///var/run/tetragon/tetragon.sock getevents
tetra client, if --server-address is not specified,
it will try to detect if Tetragon daemon is running on the same host and use its
server-address configuration.Tetragon daemon automatically loads Tracing policies from the default /etc/tetragon/tetragon.tp.d/ directory. Tracing policies can be organized in directories such: /etc/tetragon/tetragon.tp.d/file-access, /etc/tetragon/tetragon.tp.d/network-access, etc.
The --tracing-policy-dir controlling setting can be used to change the default directory from where Tracing policies are loaded.
The --tracing-policy controlling setting can be used to specify the path of one tracing policy to load.
The Tetragon Helm chart source is available under github.io/cilium/tetragon/install/kubernetes/tetragon and is distributed from the Cilium helm charts repository helm.cilium.io.
To deploy Tetragon using this Helm chart you can run the following commands:
helm repo add cilium https://helm.cilium.io
helm repo update
helm install tetragon cilium/tetragon -n kube-system
To use the values available, with helm install or helm upgrade, use --set key=value.
| Key | Type | Default | Description |
|---|---|---|---|
| affinity | object | {} | |
| certgen | object | {"affinity":{},"annotations":{"cronJob":{},"job":{}},"cronJob":{"failedJobsHistoryLimit":1,"successfulJobsHistoryLimit":1},"generateCA":true,"hostUsers":true,"image":{"override":null,"pullPolicy":"IfNotPresent","repository":"quay.io/cilium/certgen","tag":"v0.4.8"},"nodeSelector":{},"podLabels":{},"resources":{},"tolerations":[],"ttlSecondsAfterFinished":1800} | cilium-certgen settings used by tetragon.grpc.tls.auto.method=cronJob. Mirrors the same block in cilium/cilium so operators familiar with the hubble TLS workflow find consistent knobs. |
| certgen.affinity | object | {} | Affinity for certgen pods. |
| certgen.annotations | object | {"cronJob":{},"job":{}} | Annotations applied to certgen Job/CronJob objects. |
| certgen.cronJob.failedJobsHistoryLimit | int | 1 | Number of failed CronJob runs to retain. |
| certgen.cronJob.successfulJobsHistoryLimit | int | 1 | Number of successful CronJob runs to retain. |
| certgen.generateCA | bool | true | Whether the certgen invocation should generate a CA when one isn’t found in the configured CA Secret. |
| certgen.hostUsers | bool | true | Run the certgen pods in the host user namespace. certgen needs no host access, set to false to run it in a user namespace. Requires Kubernetes 1.33 or later. |
| certgen.nodeSelector | object | {} | Node selector for certgen pods. |
| certgen.podLabels | object | {} | Pod labels added to certgen pods. |
| certgen.resources | object | {} | Resource requests/limits for the certgen container. |
| certgen.tolerations | list | [] | Tolerations for certgen pods. |
| certgen.ttlSecondsAfterFinished | int | 1800 | TTL applied to the bootstrap Job once it completes. |
| crds.installMethod | string | "operator" | Method for installing CRDs. Supported values are: “operator”, “helm” and “none”. The “operator” method allows for fine-grained control over which CRDs are installed and by default doesn’t perform CRD downgrades. These can be configured in tetragonOperator section. The “helm” method always installs all CRDs for the chart version. |
| daemonSetAnnotations | object | {} | |
| daemonSetLabelsOverride | object | {} | |
| dnsPolicy | string | "Default" | DNS policy for Tetragon pods. https://kubernetes.io/docs/concepts/services-networking/dns-pod-service/#pod-s-dns-policy |
| enabled | bool | true | |
| export | object | {"filenames":["tetragon.log"],"mode":"stdout","resources":{},"securityContext":{},"stdout":{"argsOverride":[],"commandOverride":[],"enabledArgs":true,"enabledCommand":true,"envFromSecrets":[],"extraEnv":[],"extraEnvFrom":[],"extraVolumeMounts":[],"image":{"override":null,"repository":"quay.io/cilium/hubble-export-stdout","tag":"v1.1.1"}}} | Tetragon events export settings |
| export.stdout.envFromSecrets | list | [] | A simplified way to add secret references to envFrom. Can be specified either as a string (just the secret name) or as an object with additional parameters. Example: envFromSecrets: - my-simple-secret - name: my-optional-secret optional: true |
| export.stdout.extraEnv | list | [] | Extra environment variables to add to the export-stdout container. Example: extraEnv: - name: FOO value: bar - name: SECRET_KEY valueFrom: secretKeyRef: name: my-secret key: secret-key |
| export.stdout.extraEnvFrom | list | [] | Extra envFrom sources to add to the export-stdout container. This allows adding any type of envFrom source (configMapRef, secretRef, etc.). Example: extraEnvFrom: - configMapRef: name: my-config-map - secretRef: name: my-secret optional: true |
| exportDirectory | string | "/var/log/tetragon" | Directory to put Tetragon JSON export files. |
| extraConfigmapMounts | list | [] | |
| extraHostPathMounts | list | [] | |
| extraVolumes | list | [] | |
| hostNetwork | bool | true | Configures whether Tetragon pods run on the host network. IMPORTANT: Tetragon must be on the host network for the process visibility to function properly. |
| imagePullPolicy | string | "IfNotPresent" | |
| imagePullSecrets | list | [] | |
| nodeSelector | object | {} | |
| podAnnotations | object | {} | |
| podLabels | object | {} | |
| podLabelsOverride | object | {} | |
| podSecurityContext | object | {} | |
| priorityClassName | string | "" | |
| rthooks | object | {"annotations":{},"enabled":false,"exportLogs":{"enabled":true,"resources":{}},"extraHookArgs":{},"extraLabels":{},"extraVolumeMounts":[],"failAllowNamespaces":"","failAllowNamespacesRegex":[],"image":{"override":null,"repository":"quay.io/cilium/tetragon-rthooks","tag":"v0.9"},"installDir":"/opt/tetragon","interface":"","nameOverride":"","nriHook":{"nriSocket":"/var/run/nri/nri.sock"},"ociHooks":{"hooksPath":"/usr/share/containers/oci/hooks.d"},"podAnnotations":{},"podSecurityContext":{},"priorityClassName":"","resources":{},"serviceAccount":{"name":""}} | Method for installing Tetagon rthooks (tetragon-rthooks) daemonset The tetragon-rthooks daemonset is responsible for installing run-time hooks on the host. See: https://tetragon.io/docs/concepts/runtime-hooks |
| rthooks.annotations | object | {} | Annotations for the Tetragon rthooks daemonset |
| rthooks.enabled | bool | false | Enable the Tetragon rthooks daemonset |
| rthooks.exportLogs | object | {"enabled":true,"resources":{}} | exportLogs sidecar: tail the hook log file and stream it to stdout. Uses the same image as the rthooks container. |
| rthooks.exportLogs.enabled | bool | true | Enable the exportLogs sidecar container. |
| rthooks.exportLogs.resources | object | {} | resources for the exportLogs sidecar. |
| rthooks.extraHookArgs | object | {} | extra args to pass to tetragon-oci-hook |
| rthooks.extraLabels | object | {} | Extra labels for the Tetrargon rthooks daemonset |
| rthooks.extraVolumeMounts | list | [] | Extra volume mounts to add to the oci-hook-setup init container |
| rthooks.failAllowNamespaces | string | "" | Comma-separated list of namespaces to allow Pod creation for, in case tetragon-oci-hook fails to reach Tetragon agent. The namespace Tetragon is deployed in is always added as an exception and must not be added again. |
| rthooks.failAllowNamespacesRegex | list | [] | List of RE2 regex patterns for namespaces to allow Pod creation for, in case tetragon-oci-hook fails to reach Tetragon agent. Patterns perform substring matching by default; use ^ and $ anchors for full-string matching (e.g. ‘^kube-.$’ matches only namespaces starting with ‘kube-’). Can be combined with failAllowNamespaces. Ignored if extraHookArgs sets fail-cel-expr. Example: ["^acme-.$", “^dev-.*$”] |
| rthooks.image | object | {"override":null,"repository":"quay.io/cilium/tetragon-rthooks","tag":"v0.9"} | image for the Tetragon rthooks pod |
| rthooks.installDir | string | "/opt/tetragon" | installDir is the host location where the tetragon-oci-hook binary will be installed |
| rthooks.interface | string | "" | Method to use for installing rthooks. Values: “oci-hooks”: Add an apppriate file to “/usr/share/containers/oci/hooks.d”. Use this with CRI-O. See https://github.com/containers/common/blob/main/pkg/hooks/docs/oci-hooks.5.md for more details. Specific configuration for this interface can be found under “ociHooks”. “nri-hook”: Install the hook via NRI. Use this with containerd. Requires NRI being enabled. see: https://github.com/containerd/containerd/blob/main/docs/NRI.md. Specific configuration for this interface can be found under “nriHook”. |
| rthooks.nameOverride | string | "" | tetragon-rthooks name override |
| rthooks.nriHook | object | {"nriSocket":"/var/run/nri/nri.sock"} | configuration for the “nri-hook” interface |
| rthooks.nriHook.nriSocket | string | "/var/run/nri/nri.sock" | path to NRI socket |
| rthooks.ociHooks | object | {"hooksPath":"/usr/share/containers/oci/hooks.d"} | configuration for “oci-hooks” interface |
| rthooks.ociHooks.hooksPath | string | "/usr/share/containers/oci/hooks.d" | directory to install .json file for running the hook |
| rthooks.podAnnotations | object | {} | Pod annotations for the Tetrargon rthooks pod |
| rthooks.podSecurityContext | object | {} | security context for the Tetrargon rthooks pod |
| rthooks.priorityClassName | string | "" | priorityClassName for the Tetrargon rthooks pod |
| rthooks.resources | object | {} | resources for the the oci-hook-setup init container |
| rthooks.serviceAccount | object | {"name":""} | rthooks service account. |
| selectorLabelsOverride | object | {} | |
| serviceAccount.annotations | object | {} | |
| serviceAccount.create | bool | true | |
| serviceAccount.name | string | "" | |
| serviceAnnotations | object | {} | |
| serviceLabels | object | {} | |
| serviceLabelsOverride | object | {} | |
| tetragon.argsOverride | list | [] | Override the arguments. For advanced users only. |
| tetragon.btf | string | "" | |
| tetragon.cgidmap | object | {"enabled":false} | Enabling cgidmap instructs the Tetragon agent to use cgroup ids (instead of cgroup names) for pod association. This feature depends on cri being enabled. |
| tetragon.clusterName | string | "" | Name of the cluster where Tetragon is installed. Tetragon uses this value to set the cluster_name field in GetEventsResponse messages. |
| tetragon.commandOverride | list | [] | Override the command. For advanced users only. |
| tetragon.cri | object | {"enabled":false,"socketHostPath":""} | Configure tetragon pod so that it can contact the CRI running on the host |
| tetragon.cri.socketHostPath | string | "" | path of the CRI socket on the host. This will typically be “/run/containerd/containerd.sock” for containerd or “/var/run/crio/crio.sock” for crio. |
| tetragon.debug | bool | false | If you want to run Tetragon in debug mode change this value to true |
| tetragon.deletedPodCacheSize | int | 1024 | Tetragon keeps recently deleted pod/container mappings in an LRU cache to resolve pod metadata for late-arriving events. |
| tetragon.enableK8sAPI | bool | true | Access Kubernetes API to associate Tetragon events with Kubernetes pods. |
| tetragon.enableKeepSensorsOnExit | bool | false | Persistent enforcement to allow the enforcement policy to continue running even when its Tetragon process is gone. |
| tetragon.enableMsgHandlingLatency | bool | false | Enable latency monitoring in message handling |
| tetragon.enablePolicyFilter | bool | true | Enable policy filter. This is required for K8s namespace and pod-label filtering. |
| tetragon.enablePolicyFilterCgroupMap | bool | false | Enable policy filter cgroup map. |
| tetragon.enablePolicyFilterDebug | bool | false | Enable policy filter debug messages. |
| tetragon.enableProcessCred | bool | false | Enable Capabilities visibility in exec and kprobe events. |
| tetragon.enableProcessNs | bool | false | Enable Namespaces visibility in exec and kprobe events. |
| tetragon.enabled | bool | true | |
| tetragon.eventCacheRetries | int | 15 | Configure the number of retries in tetragon’s event cache. |
| tetragon.eventCacheRetryDelay | int | 2 | Configure the delay (in seconds) between retires in tetragon’s event cache. |
| tetragon.exportAllowList | string | "{\"event_set\":[\"PROCESS_EXEC\", \"PROCESS_EXIT\", \"PROCESS_KPROBE\", \"PROCESS_UPROBE\", \"PROCESS_TRACEPOINT\", \"PROCESS_LSM\"]}" | Allowlist for JSON export. For example, to export only process_connect events from the default namespace: exportAllowList: |
| tetragon.exportDenyList | string | "{\"health_check\":true}\n{\"namespace\":[\"\", \"cilium\", \"kube-system\"]}" | Denylist for JSON export (for file sinks only; does not filter gRPC output). For example, to exclude exec events that look similar to Kubernetes health checks and all the events from kube-system namespace and the host: exportDenyList: |
| tetragon.exportFileCompress | bool | false | Compress rotated JSON export files. |
| tetragon.exportFileMaxBackups | int | 5 | Number of rotated files to retain. |
| tetragon.exportFileMaxSizeMB | int | 10 | Size in megabytes at which to rotate JSON export files. |
| tetragon.exportFilePerm | string | "600" | JSON export file permissions as a string. Typically it’s either “600” (to restrict access to owner) or “640”/“644” (to allow read access by logs collector or another agent). |
| tetragon.exportFilename | string | "tetragon.log" | JSON export filename. Set it to an empty string to disable JSON export altogether. |
| tetragon.exportRateLimit | int | -1 | Rate-limit event export (events per minute), Set to -1 to export all events. |
| tetragon.extraArgs | object | {} | |
| tetragon.extraEnv | list | [] | |
| tetragon.extraVolumeMounts | list | [] | |
| tetragon.fieldFilters | string | "" | Filters to include or exclude fields from Tetragon events. Without any filters, all fields are included by default. The presence of at least one inclusion filter implies default-exclude (i.e. any fields that don’t match an inclusion filter will be excluded). Field paths are expressed using dot notation like “a.b.c” and multiple field paths can be separated by commas like “a.b.c,d,e.f”. An optional “event_set” may be specified to apply the field filter to a specific set of events. For example, to exclude the “parent” field from all events and include the “process” field in PROCESS_KPROBE events while excluding all others: fieldFilters: |
| tetragon.gops.address | string | "localhost" | The address at which to expose gops. |
| tetragon.gops.enabled | bool | false | Whether to enable exposing gops server. |
| tetragon.gops.port | int | 8118 | The port at which to expose gops. |
| tetragon.grpc.address | string | "unix:///var/run/tetragon/tetragon.sock" | The address at which to expose gRPC. Examples: localhost:54321, unix:///var/run/tetragon/tetragon.sock |
| tetragon.grpc.enabled | bool | true | Whether to enable exposing Tetragon gRPC. |
| tetragon.grpc.tls | object | {"auto":{"certManagerIssuerRef":{},"certValidityDuration":365,"enabled":true,"method":"helm","schedule":"0 0 1 */4 *"},"ca":{"cert":"","certValidityDuration":1095,"key":""},"enabled":false,"requireClientCert":false,"server":{"existingSecret":"","extraDnsNames":[],"extraIpAddresses":[]}} | gRPC TLS / mTLS configuration for the optional TCP listener (tetragon.grpc.address); the always-on unix-domain listener at /var/run/tetragon/tetragon.sock is unaffected. The auto-provisioned server cert uses a wildcard SAN over a synthetic DNS domain (*.tetragon-grpc.cilium.io) so a single Secret covers every DaemonSet pod. Clients must override SNI to tetragon.grpcTls.domain for details; add Service-style or per-node identities via server.extraDnsNames / server.extraIpAddresses below. |
| tetragon.grpc.tls.auto | object | {"certManagerIssuerRef":{},"certValidityDuration":365,"enabled":true,"method":"helm","schedule":"0 0 1 */4 *"} | Configure automatic TLS certificate generation. |
| tetragon.grpc.tls.auto.certManagerIssuerRef | object | {} | cert-manager IssuerRef used when method=certmanager. [Example] certManagerIssuerRef: group: cert-manager.io kind: ClusterIssuer name: ca-issuer |
| tetragon.grpc.tls.auto.certValidityDuration | int | 365 | Generated certificate validity duration in days. Defaults to 365 (1 year). |
| tetragon.grpc.tls.auto.enabled | bool | true | Auto-generate certificates. When false, you must provide a Secret yourself (see server.existingSecret). |
| tetragon.grpc.tls.auto.method | string | "helm" | Method used to auto-generate certificates. Supported values: - helm: Helm renders the cert/key Secret directly. - cronJob: A Kubernetes CronJob runs cilium-certgen to (re)issue the cert; a one-shot Job seeds it on install. - certmanager: cert-manager issues and rotates the cert. |
| tetragon.grpc.tls.auto.schedule | string | "0 0 1 */4 *" | Schedule for certificate regeneration; only honored when method=cronJob. Empty disables the recurring CronJob, leaving only the one-shot bootstrap Job. |
| tetragon.grpc.tls.ca | object | {"cert":"","certValidityDuration":1095,"key":""} | In-cluster CA used by the helm and cronJob methods. |
| tetragon.grpc.tls.ca.cert | string | "" | base64-encoded PEM CA certificate. When both cert and key are set, helm/cronJob reuse this CA instead of generating a fresh one. |
| tetragon.grpc.tls.ca.certValidityDuration | int | 1095 | Validity duration in days for an auto-generated CA. Only used when ca.cert/key are unset. |
| tetragon.grpc.tls.ca.key | string | "" | base64-encoded PEM CA private key. Required when ca.cert is set. |
| tetragon.grpc.tls.enabled | bool | false | Enable TLS on the TCP gRPC listener. When false, the listener (if any) is plaintext. |
| tetragon.grpc.tls.requireClientCert | bool | false | Require and verify client certificates (mTLS). When true, the agent rejects TCP gRPC connections that don’t present a valid client cert signed by one of the bundled CAs. |
| tetragon.grpc.tls.server | object | {"existingSecret":"","extraDnsNames":[],"extraIpAddresses":[]} | Server cert configuration. |
| tetragon.grpc.tls.server.existingSecret | string | "" | Use an existing Secret (must contain tls.crt + tls.key, plus ca.crt when requireClientCert is true) instead of provisioning one. Disables all auto-* methods when set. |
| tetragon.grpc.tls.server.extraDnsNames | list | [] | Extra DNS SANs added to auto-generated certificates. |
| tetragon.grpc.tls.server.extraIpAddresses | list | [] | Extra IP SANs added to auto-generated certificates. |
| tetragon.healthGrpc.enabled | bool | true | Whether to enable health gRPC server. |
| tetragon.healthGrpc.interval | int | 10 | The interval at which to check the health of the agent. |
| tetragon.healthGrpc.port | int | 6789 | The port at which to expose health gRPC. |
| tetragon.hostProcPath | string | "/proc" | Location of the host proc filesystem in the runtime environment. If the runtime runs in the host, the path is /proc. Exceptions to this are environments like kind, where the runtime itself does not run on the host. |
| tetragon.image.override | string | nil | |
| tetragon.image.repository | string | "quay.io/cilium/tetragon" | |
| tetragon.image.tag | string | "v1.7.0" | |
| tetragon.livenessProbe | object | {} | Overrides the default livenessProbe for the tetragon container. |
| tetragon.nameOverride | string | "" | |
| tetragon.podAnnotations.enabled | bool | false | |
| tetragon.pprof.address | string | "localhost" | The address at which to expose pprof. |
| tetragon.pprof.enabled | bool | false | Whether to enable exposing pprof server. |
| tetragon.pprof.port | int | 6060 | The port at which to expose pprof. |
| tetragon.processAncestors.enabled | string | "" | Comma-separated list of process event types to enable ancestors for. Supported event types are: base, kprobe, tracepoint, loader, uprobe, lsm, usdt. Unknown event types will be ignored. Type “base” is required by all other supported event types for correct reference counting. Set it to "" to disable ancestors completely. |
| tetragon.processCacheGCInterval | string | "30s" | Configure the interval (suffixed with s for seconds, m for minutes, etc) for the process cache garbage collector. |
| tetragon.processCacheSize | int | 65536 | Tetragon puts processes in an LRU cache. The cache is used to find ancestors for subsequently exec’ed processes. |
| tetragon.prometheus.address | string | "" | The address at which to expose metrics. Set it to "" to expose on all available interfaces. |
| tetragon.prometheus.enabled | bool | true | Whether to enable exposing Tetragon metrics. |
| tetragon.prometheus.metricsLabelFilter | string | "namespace,workload,pod,binary" | Comma-separated list of enabled metrics labels. The configurable labels are: namespace, workload, pod, binary. Unknown labels will be ignored. Removing some labels from the list might help reduce the metrics cardinality if needed. |
| tetragon.prometheus.port | int | 2112 | The port at which to expose metrics. |
| tetragon.prometheus.serviceMonitor.enabled | bool | false | Whether to create a ‘ServiceMonitor’ resource targeting the tetragon pods. |
| tetragon.prometheus.serviceMonitor.extraLabels | object | {} | Extra labels to be added on the Tetragon ServiceMonitor. |
| tetragon.prometheus.serviceMonitor.labelsOverride | object | {} | The set of labels to place on the ‘ServiceMonitor’ resource. |
| tetragon.prometheus.serviceMonitor.scrapeInterval | string | "60s" | Interval at which metrics should be scraped. If not specified, Prometheus’ global scrape interval is used. |
| tetragon.redactionFilters | string | "" | Filters to redact secrets from the args fields in Tetragon events. To perform redactions, redaction filters define RE2 regular expressions in the redact field. Any capture groups in these RE2 regular expressions are redacted and replaced with “*****”. For more control, you can select which binary or binaries should have their arguments redacted with the binary_regex field. NOTE: This feature uses RE2 as its regular expression library. Make sure that you follow RE2 regular expression guidelines as you may observe unexpected results otherwise. More information on RE2 syntax can be found here. NOTE: When writing regular expressions in JSON, it is important to escape backslash characters. For instance \Wpasswd\W? would be written as {"redact": "\\Wpasswd\\W?"}. As a concrete example, the following will redact all passwords passed to processes with the “–password” argument: {“redact”: ["–password(?:\s+ |
| tetragon.resources | object | {} | |
| tetragon.securityContext.privileged | bool | true | |
| tetragon.usePerfRingBuffer | bool | false | |
| tetragonOperator.affinity.podAntiAffinity.preferredDuringSchedulingIgnoredDuringExecution[0].podAffinityTerm.labelSelector.matchLabels.“app.kubernetes.io/name” | string | "tetragon-operator" | |
| tetragonOperator.affinity.podAntiAffinity.preferredDuringSchedulingIgnoredDuringExecution[0].podAffinityTerm.topologyKey | string | "kubernetes.io/hostname" | |
| tetragonOperator.affinity.podAntiAffinity.preferredDuringSchedulingIgnoredDuringExecution[0].weight | int | 100 | |
| tetragonOperator.annotations | object | {} | Annotations for the Tetragon Operator Deployment. |
| tetragonOperator.containerSecurityContext | object | {"allowPrivilegeEscalation":false,"capabilities":{"drop":["ALL"]},"runAsGroup":65532,"runAsNonRoot":true,"runAsUser":65532} | securityContext for the Tetragon Operator Deployment Pod container. |
| tetragonOperator.enabled | bool | true | Enables the Tetragon Operator. |
| tetragonOperator.extraLabels | object | {} | Extra labels to be added on the Tetragon Operator Deployment. |
| tetragonOperator.extraPodLabels | object | {} | Extra labels to be added on the Tetragon Operator Deployment Pods. |
| tetragonOperator.extraVolumeMounts | list | [] | |
| tetragonOperator.extraVolumes | list | [] | Extra volumes for the Tetragon Operator Deployment. |
| tetragonOperator.failoverLease | object | {"enabled":false,"leaseDuration":"15s","leaseRenewDeadline":"5s","leaseRetryPeriod":"2s","namespace":""} | Lease handling for an automated failover when running multiple replicas |
| tetragonOperator.failoverLease.enabled | bool | false | Enable lease failover functionality |
| tetragonOperator.failoverLease.leaseDuration | string | "15s" | If a lease is not renewed for X duration, the current leader is considered dead, a new leader is picked |
| tetragonOperator.failoverLease.leaseRenewDeadline | string | "5s" | The interval at which the leader will renew the lease |
| tetragonOperator.failoverLease.leaseRetryPeriod | string | "2s" | The timeout between retries if renewal fails |
| tetragonOperator.failoverLease.namespace | string | "" | Kubernetes Namespace in which the Lease resource is created. Defaults to the namespace where Tetragon is deployed in, if it’s empty. |
| tetragonOperator.forceUpdateCRDs | bool | false | |
| tetragonOperator.hostUsers | bool | true | Run the Tetragon Operator Deployment Pods in the host user namespace. The operator needs no host access, set to false to run it in a user namespace. Requires Kubernetes 1.33 or later. |
| tetragonOperator.image | object | {"override":null,"pullPolicy":"IfNotPresent","repository":"quay.io/cilium/tetragon-operator","tag":"v1.7.0"} | tetragon-operator image. |
| tetragonOperator.nameOverride | string | "" | The name of the Tetragon Operator deployment. |
| tetragonOperator.nodeSelector | object | {} | Steer the Tetragon Operator Deployment Pod placement via nodeSelector, tolerations and affinity rules. |
| tetragonOperator.podAnnotations | object | {} | Annotations for the Tetragon Operator Deployment Pods. |
| tetragonOperator.podInfo.enabled | bool | false | Enables the PodInfo CRD and the controller that reconciles PodInfo custom resources. |
| tetragonOperator.podSecurityContext | object | {} | securityContext for the Tetragon Operator Deployment Pods. |
| tetragonOperator.priorityClassName | string | "" | priorityClassName for the Tetragon Operator Deployment Pods. |
| tetragonOperator.prometheus.address | string | "" | The address at which to expose Tetragon Operator metrics. Set it to "" to expose on all available interfaces. |
| tetragonOperator.prometheus.enabled | bool | true | Enables the Tetragon Operator metrics. |
| tetragonOperator.prometheus.port | int | 2113 | The port at which to expose metrics. |
| tetragonOperator.prometheus.serviceMonitor.enabled | bool | false | Whether to create a ‘ServiceMonitor’ resource targeting the tetragonOperator pods. |
| tetragonOperator.prometheus.serviceMonitor.extraLabels | object | {} | Extra labels to be added on the Tetragon Operator ServiceMonitor. |
| tetragonOperator.prometheus.serviceMonitor.labelsOverride | object | {} | The set of labels to place on the ‘ServiceMonitor’ resource. |
| tetragonOperator.prometheus.serviceMonitor.scrapeInterval | string | "60s" | Interval at which metrics should be scraped. If not specified, Prometheus’ global scrape interval is used. |
| tetragonOperator.replicas | int | 1 | Number of replicas to run for the tetragon-operator deployment |
| tetragonOperator.resources | object | {"limits":{"cpu":"500m","memory":"128Mi"},"requests":{"cpu":"10m","memory":"64Mi"}} | resources for the Tetragon Operator Deployment Pod container. |
| tetragonOperator.securityContext | object | {} | securityContext for the Tetragon Operator Deployment Pod container. (DEPRECATED: Use containerSecurityContext instead. TODO: Remove in v1.6.0) |
| tetragonOperator.serviceAccount | object | {"annotations":{},"create":true,"name":""} | tetragon-operator service account. |
| tetragonOperator.strategy | object | {"rollingUpdate":{"maxSurge":1,"maxUnavailable":0},"type":"RollingUpdate"} | resources for the Tetragon Operator Deployment update strategy |
| tetragonOperator.tolerations | list | [] | |
| tetragonOperator.tracingPolicy.enabled | bool | true | Enables the TracingPolicy and TracingPolicyNamespaced CRD creation. |
| tolerations[0].operator | string | "Exists" | |
| updateStrategy | object | {} |
The Tetragon API is an independant Go module that can be found in the Tetragon repository under api. The version 1 of this API is defined in github.com/cilium/tetragon/api/v1/tetragon.
| Name | Number | Description |
|---|---|---|
| BPF_MAP_CREATE | 0 | Create a map and return a file descriptor that refers to the map. |
| BPF_MAP_LOOKUP_ELEM | 1 | Look up an element with a given key in the map referred to by the file descriptor map_fd. |
| BPF_MAP_UPDATE_ELEM | 2 | Create or update an element (key/value pair) in a specified map. |
| BPF_MAP_DELETE_ELEM | 3 | Look up and delete an element by key in a specified map. |
| BPF_MAP_GET_NEXT_KEY | 4 | Look up an element by key in a specified map and return the key of the next element. Can be used to iterate over all elements in the map. |
| BPF_PROG_LOAD | 5 | Verify and load an eBPF program, returning a new file descriptor associated with the program. |
| BPF_OBJ_PIN | 6 | Pin an eBPF program or map referred by the specified bpf_fd to the provided pathname on the filesystem. |
| BPF_OBJ_GET | 7 | Open a file descriptor for the eBPF object pinned to the specified pathname. |
| BPF_PROG_ATTACH | 8 | Attach an eBPF program to a target_fd at the specified attach_type hook. |
| BPF_PROG_DETACH | 9 | Detach the eBPF program associated with the target_fd at the hook specified by attach_type. |
| BPF_PROG_TEST_RUN | 10 | Run the eBPF program associated with the prog_fd a repeat number of times against a provided program context ctx_in and data data_in, and return the modified program context ctx_out, data_out (for example, packet data), result of the execution retval, and duration of the test run. |
| BPF_PROG_GET_NEXT_ID | 11 | Fetch the next eBPF program currently loaded into the kernel. |
| BPF_MAP_GET_NEXT_ID | 12 | Fetch the next eBPF map currently loaded into the kernel. |
| BPF_PROG_GET_FD_BY_ID | 13 | Open a file descriptor for the eBPF program corresponding to prog_id. |
| BPF_MAP_GET_FD_BY_ID | 14 | Open a file descriptor for the eBPF map corresponding to map_id. |
| BPF_OBJ_GET_INFO_BY_FD | 15 | Obtain information about the eBPF object corresponding to bpf_fd. |
| BPF_PROG_QUERY | 16 | Obtain information about eBPF programs associated with the specified attach_type hook. |
| BPF_RAW_TRACEPOINT_OPEN | 17 | Attach an eBPF program to a tracepoint name to access kernel internal arguments of the tracepoint in their raw form. |
| BPF_BTF_LOAD | 18 | Verify and load BPF Type Format (BTF) metadata into the kernel, returning a new file descriptor associated with the metadata. |
| BPF_BTF_GET_FD_BY_ID | 19 | Open a file descriptor for the BPF Type Format (BTF) corresponding to btf_id. |
| BPF_TASK_FD_QUERY | 20 | Obtain information about eBPF programs associated with the target process identified by pid and fd. |
| BPF_MAP_LOOKUP_AND_DELETE_ELEM | 21 | Look up an element with the given key in the map referred to by the file descriptor fd, and if found, delete the element. |
| BPF_MAP_FREEZE | 22 | Freeze the permissions of the specified map. |
| BPF_BTF_GET_NEXT_ID | 23 | Fetch the next BPF Type Format (BTF) object currently loaded into the kernel. |
| BPF_MAP_LOOKUP_BATCH | 24 | Iterate and fetch multiple elements in a map. |
| BPF_MAP_LOOKUP_AND_DELETE_BATCH | 25 | Iterate and delete all elements in a map. |
| BPF_MAP_UPDATE_BATCH | 26 | Update multiple elements in a map by key. |
| BPF_MAP_DELETE_BATCH | 27 | Delete multiple elements in a map by key. |
| BPF_LINK_CREATE | 28 | Attach an eBPF program to a target_fd at the specified attach_type hook and return a file descriptor handle for managing the link. |
| BPF_LINK_UPDATE | 29 | Update the eBPF program in the specified link_fd to new_prog_fd. |
| BPF_LINK_GET_FD_BY_ID | 30 | Open a file descriptor for the eBPF Link corresponding to link_id. |
| BPF_LINK_GET_NEXT_ID | 31 | Fetch the next eBPF link currently loaded into the kernel. |
| BPF_ENABLE_STATS | 32 | Enable eBPF runtime statistics gathering. |
| BPF_ITER_CREATE | 33 | Create an iterator on top of the specified link_fd (as previously created using BPF_LINK_CREATE) and return a file descriptor that can be used to trigger the iteration. |
| BPF_LINK_DETACH | 34 | Forcefully detach the specified link_fd from its corresponding attachment point. |
| BPF_PROG_BIND_MAP | 35 | Bind a map to the lifetime of an eBPF program. |
| BPF_TOKEN_CREATE | 36 | Create BPF token with embedded information about what can be passed as an extra parameter to various bpf() syscall commands to grant BPF subsystem functionality to unprivileged processes. |
| Name | Number | Description |
|---|---|---|
| BPF_PROG_TYPE_UNSPEC | 0 | |
| BPF_PROG_TYPE_SOCKET_FILTER | 1 | |
| BPF_PROG_TYPE_KPROBE | 2 | |
| BPF_PROG_TYPE_SCHED_CLS | 3 | |
| BPF_PROG_TYPE_SCHED_ACT | 4 | |
| BPF_PROG_TYPE_TRACEPOINT | 5 | |
| BPF_PROG_TYPE_XDP | 6 | |
| BPF_PROG_TYPE_PERF_EVENT | 7 | |
| BPF_PROG_TYPE_CGROUP_SKB | 8 | |
| BPF_PROG_TYPE_CGROUP_SOCK | 9 | |
| BPF_PROG_TYPE_LWT_IN | 10 | |
| BPF_PROG_TYPE_LWT_OUT | 11 | |
| BPF_PROG_TYPE_LWT_XMIT | 12 | |
| BPF_PROG_TYPE_SOCK_OPS | 13 | |
| BPF_PROG_TYPE_SK_SKB | 14 | |
| BPF_PROG_TYPE_CGROUP_DEVICE | 15 | |
| BPF_PROG_TYPE_SK_MSG | 16 | |
| BPF_PROG_TYPE_RAW_TRACEPOINT | 17 | |
| BPF_PROG_TYPE_CGROUP_SOCK_ADDR | 18 | |
| BPF_PROG_TYPE_LWT_SEG6LOCAL | 19 | |
| BPF_PROG_TYPE_LIRC_MODE2 | 20 | |
| BPF_PROG_TYPE_SK_REUSEPORT | 21 | |
| BPF_PROG_TYPE_FLOW_DISSECTOR | 22 | |
| BPF_PROG_TYPE_CGROUP_SYSCTL | 23 | |
| BPF_PROG_TYPE_RAW_TRACEPOINT_WRITABLE | 24 | |
| BPF_PROG_TYPE_CGROUP_SOCKOPT | 25 | |
| BPF_PROG_TYPE_TRACING | 26 | |
| BPF_PROG_TYPE_STRUCT_OPS | 27 | |
| BPF_PROG_TYPE_EXT | 28 | |
| BPF_PROG_TYPE_LSM | 29 | |
| BPF_PROG_TYPE_SK_LOOKUP | 30 | |
| BPF_PROG_TYPE_SYSCALL | 31 | |
| BPF_PROG_TYPE_NETFILTER | 32 |
| Name | Number | Description |
|---|---|---|
| CAP_CHOWN | 0 | In a system with the [_POSIX_CHOWN_RESTRICTED] option defined, this overrides the restriction of changing file ownership and group ownership. |
| DAC_OVERRIDE | 1 | Override all DAC access, including ACL execute access if [_POSIX_ACL] is defined. Excluding DAC access covered by CAP_LINUX_IMMUTABLE. |
| CAP_DAC_READ_SEARCH | 2 | Overrides all DAC restrictions regarding read and search on files and directories, including ACL restrictions if [_POSIX_ACL] is defined. Excluding DAC access covered by "$1"_LINUX_IMMUTABLE. |
| CAP_FOWNER | 3 | Overrides all restrictions about allowed operations on files, where file owner ID must be equal to the user ID, except where CAP_FSETID is applicable. It doesn't override MAC and DAC restrictions. |
| CAP_FSETID | 4 | Overrides the following restrictions that the effective user ID shall match the file owner ID when setting the S_ISUID and S_ISGID bits on that file; that the effective group ID (or one of the supplementary group IDs) shall match the file owner ID when setting the S_ISGID bit on that file; that the S_ISUID and S_ISGID bits are cleared on successful return from chown(2) (not implemented). |
| CAP_KILL | 5 | Overrides the restriction that the real or effective user ID of a process sending a signal must match the real or effective user ID of the process receiving the signal. |
| CAP_SETGID | 6 | Allows forged gids on socket credentials passing. |
| CAP_SETUID | 7 | Allows forged pids on socket credentials passing. |
| CAP_SETPCAP | 8 | Without VFS support for capabilities: Transfer any capability in your permitted set to any pid, remove any capability in your permitted set from any pid With VFS support for capabilities (neither of above, but) Add any capability from current's capability bounding set to the current process' inheritable set Allow taking bits out of capability bounding set Allow modification of the securebits for a process |
| CAP_LINUX_IMMUTABLE | 9 | Allow modification of S_IMMUTABLE and S_APPEND file attributes |
| CAP_NET_BIND_SERVICE | 10 | Allows binding to ATM VCIs below 32 |
| CAP_NET_BROADCAST | 11 | Allow broadcasting, listen to multicast |
| CAP_NET_ADMIN | 12 | Allow activation of ATM control sockets |
| CAP_NET_RAW | 13 | Allow binding to any address for transparent proxying (also via NET_ADMIN) |
| CAP_IPC_LOCK | 14 | Allow mlock and mlockall (which doesn't really have anything to do with IPC) |
| CAP_IPC_OWNER | 15 | Override IPC ownership checks |
| CAP_SYS_MODULE | 16 | Insert and remove kernel modules - modify kernel without limit |
| CAP_SYS_RAWIO | 17 | Allow sending USB messages to any device via /dev/bus/usb |
| CAP_SYS_CHROOT | 18 | Allow use of chroot() |
| CAP_SYS_PTRACE | 19 | Allow ptrace() of any process |
| CAP_SYS_PACCT | 20 | Allow configuration of process accounting |
| CAP_SYS_ADMIN | 21 | Allow everything under CAP_BPF and CAP_PERFMON for backward compatibility |
| CAP_SYS_BOOT | 22 | Allow use of reboot() |
| CAP_SYS_NICE | 23 | Allow setting cpu affinity on other processes |
| CAP_SYS_RESOURCE | 24 | Control memory reclaim behavior |
| CAP_SYS_TIME | 25 | Allow setting the real-time clock |
| CAP_SYS_TTY_CONFIG | 26 | Allow vhangup() of tty |
| CAP_MKNOD | 27 | Allow the privileged aspects of mknod() |
| CAP_LEASE | 28 | Allow taking of leases on files |
| CAP_AUDIT_WRITE | 29 | Allow writing the audit log via unicast netlink socket |
| CAP_AUDIT_CONTROL | 30 | Allow configuration of audit via unicast netlink socket |
| CAP_SETFCAP | 31 | Set or remove capabilities on files |
| CAP_MAC_OVERRIDE | 32 | Override MAC access. The base kernel enforces no MAC policy. An LSM may enforce a MAC policy, and if it does and it chooses to implement capability based overrides of that policy, this is the capability it should use to do so. |
| CAP_MAC_ADMIN | 33 | Allow MAC configuration or state changes. The base kernel requires no MAC configuration. An LSM may enforce a MAC policy, and if it does and it chooses to implement capability based checks on modifications to that policy or the data required to maintain it, this is the capability it should use to do so. |
| CAP_SYSLOG | 34 | Allow configuring the kernel's syslog (printk behaviour) |
| CAP_WAKE_ALARM | 35 | Allow triggering something that will wake the system |
| CAP_BLOCK_SUSPEND | 36 | Allow preventing system suspends |
| CAP_AUDIT_READ | 37 | Allow reading the audit log via multicast netlink socket |
| CAP_PERFMON | 38 | Allow system performance and observability privileged operations using perf_events, i915_perf and other kernel subsystems |
| CAP_BPF | 39 | CAP_BPF allows the following BPF operations: - Creating all types of BPF maps - Advanced verifier features - Indirect variable access - Bounded loops - BPF to BPF function calls - Scalar precision tracking - Larger complexity limits - Dead code elimination - And potentially other features - Loading BPF Type Format (BTF) data - Retrieve xlated and JITed code of BPF programs - Use bpf_spin_lock() helper CAP_PERFMON relaxes the verifier checks further: - BPF progs can use of pointer-to-integer conversions - speculation attack hardening measures are bypassed - bpf_probe_read to read arbitrary kernel memory is allowed - bpf_trace_printk to print kernel memory is allowed CAP_SYS_ADMIN is required to use bpf_probe_write_user. CAP_SYS_ADMIN is required to iterate system wide loaded programs, maps, links, BTFs and convert their IDs to file descriptors. CAP_PERFMON and CAP_BPF are required to load tracing programs. CAP_NET_ADMIN and CAP_BPF are required to load networking programs. |
| CAP_CHECKPOINT_RESTORE | 40 | Allow writing to ns_last_pid |
Reasons of why the process privileges changed.
| Name | Number | Description |
|---|---|---|
| PRIVILEGES_CHANGED_UNSET | 0 | |
| PRIVILEGES_RAISED_EXEC_FILE_CAP | 1 | A privilege elevation happened due to the execution of a binary with file capability sets. The kernel supports associating capability sets with an executable file using setcap command. The file capability sets are stored in an extended attribute (see https://man7.org/linux/man-pages/man7/xattr.7.html) named security.capability. The file capability sets, in conjunction with the capability sets of the process, determine the process capabilities and privileges after the execve system call. For further reference, please check sections File capability extended attribute versioning and Namespaced file capabilities of the capabilities man pages: https://man7.org/linux/man-pages/man7/capabilities.7.html. The new granted capabilities can be listed inside the process object. |
| PRIVILEGES_RAISED_EXEC_FILE_SETUID | 2 | A privilege elevation happened due to the execution of a binary with set-user-ID to root. When a process with nonzero UIDs executes a binary with a set-user-ID to root also known as suid-root executable, then the kernel switches the effective user ID to 0 (root) which is a privilege elevation operation since it grants access to resources owned by the root user. The effective user ID is listed inside the process_credentials part of the process object. For further reading, section Capabilities and execution of programs by root of https://man7.org/linux/man-pages/man7/capabilities.7.html. Afterward the kernel recalculates the capability sets of the process and grants all capabilities in the permitted and effective capability sets, except those masked out by the capability bounding set. If the binary also have file capability sets then these bits are honored and the process gains just the capabilities granted by the file capability sets (i.e., not all capabilities, as it would occur when executing a set-user-ID to root binary that does not have any associated file capabilities). This is described in section Set-user-ID-root programs that have file capabilities of https://man7.org/linux/man-pages/man7/capabilities.7.html. The new granted capabilities can be listed inside the process object. There is one exception for the special treatments of set-user-ID to root execution receiving all capabilities, if the SecBitNoRoot bit of the Secure bits is set, then the kernel does not grant any capability. Please check section: The securebits flags: establishing a capabilities-only environment of the capabilities man pages: https://man7.org/linux/man-pages/man7/capabilities.7.html |
| PRIVILEGES_RAISED_EXEC_FILE_SETGID | 3 | A privilege elevation happened due to the execution of a binary with set-group-ID to root. When a process with nonzero GIDs executes a binary with a set-group-ID to root, the kernel switches the effective group ID to 0 (root) which is a privilege elevation operation since it grants access to resources owned by the root group. The effective group ID is listed inside the process_credentials part of the process object. |
| Name | Number | Description |
|---|---|---|
| SecBitNotSet | 0 | |
| SecBitNoRoot | 1 | When set UID 0 has no special privileges. When unset, inheritance of root-permissions and suid-root executable under compatibility mode is supported. If the effective uid of the new process is 0 then the effective and inheritable bitmasks of the executable file is raised. If the real uid is 0, the effective (legacy) bit of the executable file is raised. |
| SecBitNoRootLocked | 2 | Make bit-0 SecBitNoRoot immutable |
| SecBitNoSetUidFixup | 4 | When set, setuid to/from uid 0 does not trigger capability-"fixup". When unset, to provide compatiblility with old programs relying on set*uid to gain/lose privilege, transitions to/from uid 0 cause capabilities to be gained/lost. |
| SecBitNoSetUidFixupLocked | 8 | Make bit-2 SecBitNoSetUidFixup immutable |
| SecBitKeepCaps | 16 | When set, a process can retain its capabilities even after transitioning to a non-root user (the set-uid fixup suppressed by bit 2). Bit-4 is cleared when a process calls exec(); setting both bit 4 and 5 will create a barrier through exec that no exec()'d child can use this feature again. |
| SecBitKeepCapsLocked | 32 | Make bit-4 SecBitKeepCaps immutable |
| SecBitNoCapAmbientRaise | 64 | When set, a process cannot add new capabilities to its ambient set. |
| SecBitNoCapAmbientRaiseLocked | 128 | Make bit-6 SecBitNoCapAmbientRaise immutable |
| Field | Type | Label | Description |
|---|---|---|---|
| max_size | int32 | ||
| rotation_interval | string | ||
| max_backups | int32 |
| Field | Type | Label | Description |
|---|---|---|---|
| max_size | int32 | optional | |
| rotation_interval | string | optional | |
| max_backups | int32 | optional |
| Method Name | Request Type | Response Type | Description |
|---|---|---|---|
| SetEventLogParams | SetEventLogParamsRequest | SetEventLogParamsResponse | |
| GetEventLogParams | GetEventLogParamsRequest | GetEventLogParamsResponse |
| Field | Type | Label | Description |
|---|---|---|---|
| setuid | google.protobuf.UInt32Value | If set then this is the set user ID used for execution | |
| setgid | google.protobuf.UInt32Value | If set then this is the set group ID used for execution | |
| privileges_changed | ProcessPrivilegesChanged | repeated | The reasons why this binary execution changed privileges. Usually this happens when the process executes a binary with the set-user-ID to root or file capability sets. The final granted privileges can be listed inside the process_credentials or capabilities fields part of of the process object. |
| file | FileProperties | File properties in case the executed binary is: 1. An anonymous shared memory file https://man7.org/linux/man-pages/man7/shm_overview.7.html. 2. An anonymous file obtained with memfd API https://man7.org/linux/man-pages/man2/memfd_create.2.html. 3. Or it was deleted from the file system. |
| Field | Type | Label | Description |
|---|---|---|---|
| permitted | CapabilitiesType | repeated | Permitted set indicates what capabilities the process can use. This is a limiting superset for the effective capabilities that the thread may assume. It is also a limiting superset for the capabilities that may be added to the inheritable set by a thread without the CAP_SETPCAP in its effective set. |
| effective | CapabilitiesType | repeated | Effective set indicates what capabilities are active in a process. This is the set used by the kernel to perform permission checks for the thread. |
| inheritable | CapabilitiesType | repeated | Inheritable set indicates which capabilities will be inherited by the current process when running as a root user. |
| Field | Type | Label | Description |
|---|---|---|---|
| id | string | Identifier of the container. | |
| name | string | Name of the container. | |
| image | Image | Image of the container. | |
| start_time | google.protobuf.Timestamp | Start time of the container. | |
| pid | google.protobuf.UInt32Value | Process identifier in the container namespace. | |
| maybe_exec_probe | bool | If this is set true, it means that the process might have been originated from a Kubernetes exec probe. For this field to be true, the following must be true: 1. The binary field matches the first element of the exec command list for either liveness or readiness probe excluding the basename. For example, "/bin/ls" and "ls" are considered a match. 2. The arguments field exactly matches the rest of the exec command list. | |
| security_context | SecurityContext | The security context of the container |
CreateContainer informs the agent that a container was created This is intented to be used by OCI hooks (but not limited to them) and corresponds to the CreateContainer hook: https://github.com/opencontainers/runtime-spec/blob/main/config.md#createcontainer-hooks.
The containerName, containerID, podName, podUID, and podNamespace fields are retrieved from the annotations as a convenience, and may be left empty if the corresponding annotations are not found.
| Field | Type | Label | Description |
|---|---|---|---|
| cgroupsPath | string | cgroupsPath is the cgroups path for the container. The path is expected to be relative to the cgroups mountpoint. See: https://github.com/opencontainers/runtime-spec/blob/58ec43f9fc39e0db229b653ae98295bfde74aeab/specs-go/config.go#L174 | |
| rootDir | string | rootDir is the absolute path of the root directory of the container. See: https://github.com/opencontainers/runtime-spec/blob/main/specs-go/config.go#L174 | |
| annotations | CreateContainer.AnnotationsEntry | repeated | annotations are the run-time annotations for the container see https://github.com/opencontainers/runtime-spec/blob/main/config.md#annotations |
| containerName | string | containerName is the name of the container | |
| containerID | string | containerID is the id of the container | |
| podName | string | podName is the pod name | |
| podUID | string | podUID is the pod uid | |
| podNamespace | string | podNamespace is the namespace of the pod | |
| containerImage | string | containerImage is the full image location (repo + image) | |
| mounts | Mount | repeated | Mounts configures additional mounts (on top of Root). |
| Field | Type | Label | Description |
|---|---|---|---|
| key | string | ||
| value | string |
Environment variable
| Field | Type | Label | Description |
|---|---|---|---|
| Key | string | ||
| Value | string |
| Field | Type | Label | Description |
|---|---|---|---|
| inode | InodeProperties | Inode of the file | |
| path | string | Path of the file |
| Field | Type | Label | Description |
|---|---|---|---|
| event_set | HealthStatusType | repeated |
| Field | Type | Label | Description |
|---|---|---|---|
| health_status | HealthStatus | repeated |
| Field | Type | Label | Description |
|---|---|---|---|
| event | HealthStatusType | ||
| status | HealthStatusResult | ||
| details | string |
| Field | Type | Label | Description |
|---|---|---|---|
| id | string | Identifier of the container image composed of the registry path and the sha256. | |
| name | string | Name of the container image composed of the registry path and the tag. |
| Field | Type | Label | Description |
|---|---|---|---|
| number | uint64 | The inode number | |
| links | google.protobuf.UInt32Value | The inode links on the file system. If zero means the file is only in memory |
| Field | Type | Label | Description |
|---|---|---|---|
| name | string | Kernel module name | |
| signature_ok | google.protobuf.BoolValue | If true the module signature was verified successfully. Depends on kernels compiled with CONFIG_MODULE_SIG option, for details please read: https://www.kernel.org/doc/Documentation/admin-guide/module-signing.rst | |
| tainted | TaintedBitsType | repeated | The module tainted flags that will be applied on the kernel. For further details please read: https://docs.kernel.org/admin-guide/tainted-kernels.html |
| Field | Type | Label | Description |
|---|---|---|---|
| string_arg | string | ||
| int_arg | int32 | ||
| skb_arg | KprobeSkb | ||
| size_arg | uint64 | ||
| bytes_arg | bytes | ||
| path_arg | KprobePath | ||
| file_arg | KprobeFile | ||
| truncated_bytes_arg | KprobeTruncatedBytes | ||
| sock_arg | KprobeSock | ||
| cred_arg | KprobeCred | ||
| long_arg | int64 | ||
| bpf_attr_arg | KprobeBpfAttr | ||
| perf_event_arg | KprobePerfEvent | ||
| bpf_map_arg | KprobeBpfMap | ||
| uint_arg | uint32 | ||
| user_namespace_arg | KprobeUserNamespace | Deprecated. | |
| capability_arg | KprobeCapability | ||
| process_credentials_arg | ProcessCredentials | ||
| user_ns_arg | UserNamespace | ||
| module_arg | KernelModule | ||
| kernel_cap_t_arg | string | Capabilities in hexadecimal format. | |
| cap_inheritable_arg | string | Capabilities inherited by a forked process in hexadecimal format. | |
| cap_permitted_arg | string | Capabilities that are currently permitted in hexadecimal format. | |
| cap_effective_arg | string | Capabilities that are actually used in hexadecimal format. | |
| linux_binprm_arg | KprobeLinuxBinprm | ||
| net_dev_arg | KprobeNetDev | ||
| bpf_cmd_arg | BpfCmd | ||
| syscall_id | SyscallId | ||
| sockaddr_arg | KprobeSockaddr | ||
| bpf_prog_arg | KprobeBpfProg | ||
| error_arg | KprobeError | ||
| sockaddrun_arg | KprobeSockaddrUn | ||
| label | string |
| Field | Type | Label | Description |
|---|---|---|---|
| ProgType | string | ||
| InsnCnt | uint32 | ||
| ProgName | string |
| Field | Type | Label | Description |
|---|---|---|---|
| MapType | string | ||
| KeySize | uint32 | ||
| ValueSize | uint32 | ||
| MaxEntries | uint32 | ||
| MapName | string |
| Field | Type | Label | Description |
|---|---|---|---|
| ProgType | string | ||
| InsnCnt | uint32 | ||
| ProgName | string |
| Field | Type | Label | Description |
|---|---|---|---|
| value | google.protobuf.Int32Value | ||
| name | string |
| Field | Type | Label | Description |
|---|---|---|---|
| permitted | CapabilitiesType | repeated | |
| effective | CapabilitiesType | repeated | |
| inheritable | CapabilitiesType | repeated |
| Field | Type | Label | Description |
|---|---|---|---|
| Message | string |
| Field | Type | Label | Description |
|---|---|---|---|
| mount | string | ||
| path | string | ||
| flags | string | ||
| permission | string |
| Field | Type | Label | Description |
|---|---|---|---|
| path | string | ||
| flags | string | ||
| permission | string |
| Field | Type | Label | Description |
|---|---|---|---|
| name | string |
| Field | Type | Label | Description |
|---|---|---|---|
| mount | string | ||
| path | string | ||
| flags | string | ||
| permission | string |
| Field | Type | Label | Description |
|---|---|---|---|
| KprobeFunc | string | ||
| Type | string | ||
| Config | uint64 | ||
| ProbeOffset | uint64 |
| Field | Type | Label | Description |
|---|---|---|---|
| hash | uint32 | ||
| len | uint32 | ||
| priority | uint32 | ||
| mark | uint32 | ||
| saddr | string | ||
| daddr | string | ||
| sport | uint32 | ||
| dport | uint32 | ||
| proto | uint32 | ||
| sec_path_len | uint32 | ||
| sec_path_olen | uint32 | ||
| protocol | string | ||
| family | string |
| Field | Type | Label | Description |
|---|---|---|---|
| family | string | ||
| type | string | ||
| protocol | string | ||
| mark | uint32 | ||
| priority | uint32 | ||
| saddr | string | ||
| daddr | string | ||
| sport | uint32 | ||
| dport | uint32 | ||
| cookie | uint64 | ||
| state | string |
| Field | Type | Label | Description |
|---|---|---|---|
| family | string | ||
| addr | string | ||
| port | uint32 |
| Field | Type | Label | Description |
|---|---|---|---|
| family | string | ||
| path | string |
| Field | Type | Label | Description |
|---|---|---|---|
| bytes_arg | bytes | ||
| orig_size | uint64 |
| Field | Type | Label | Description |
|---|---|---|---|
| level | google.protobuf.Int32Value | ||
| owner | google.protobuf.UInt32Value | ||
| group | google.protobuf.UInt32Value | ||
| ns | Namespace |
| Field | Type | Label | Description |
|---|---|---|---|
| destination | string | Destination is the absolute path where the mount will be placed in the container. | |
| type | string | Type specifies the mount kind. | |
| source | string | Source specifies the source path of the mount. | |
| options | string | repeated | Options are fstab style mount options. |
| Field | Type | Label | Description |
|---|---|---|---|
| inum | uint32 | Inode number of the namespace. | |
| is_host | bool | Indicates if namespace belongs to host. |
| Field | Type | Label | Description |
|---|---|---|---|
| uts | Namespace | Hostname and NIS domain name. | |
| ipc | Namespace | System V IPC, POSIX message queues. | |
| mnt | Namespace | Mount points. | |
| pid | Namespace | Process IDs. | |
| pid_for_children | Namespace | Process IDs for children processes. | |
| net | Namespace | Network devices, stacks, ports, etc. | |
| time | Namespace | Boot and monotonic clocks. | |
| time_for_children | Namespace | Boot and monotonic clocks for children processes. | |
| cgroup | Namespace | Cgroup root directory. | |
| user | Namespace | User and group IDs. |
| Field | Type | Label | Description |
|---|---|---|---|
| namespace | string | Kubernetes namespace of the Pod. | |
| name | string | Name of the Pod. | |
| uid | string | UID of the Pod. | |
| container | Container | Container of the Pod from which the process that triggered the event originates. | |
| pod_labels | Pod.PodLabelsEntry | repeated | Contains all the labels of the pod. |
| workload | string | Kubernetes workload of the Pod. | |
| workload_kind | string | Kubernetes workload kind (e.g. "Deployment", "DaemonSet") of the Pod. | |
| pod_annotations | Pod.PodAnnotationsEntry | repeated | Contains all the annotations of the pod. |
| Field | Type | Label | Description |
|---|---|---|---|
| key | string | ||
| value | string |
| Field | Type | Label | Description |
|---|---|---|---|
| key | string | ||
| value | string |
| Field | Type | Label | Description |
|---|---|---|---|
| exec_id | string | Exec ID uniquely identifies the process over time across all the nodes in the cluster. | |
| pid | google.protobuf.UInt32Value | Process identifier from host PID namespace. | |
| uid | google.protobuf.UInt32Value | The effective User identifier used for permission checks. This field maps to the 'ProcessCredentials.euid' field. Run with the --enable-process-cred flag to enable 'ProcessCredentials' and get all the User and Group identifiers. | |
| cwd | string | Current working directory of the process. | |
| binary | string | Absolute path of the executed binary. | |
| arguments | string | Arguments passed to the binary at execution. | |
| flags | string | Flags are for debugging purposes only and should not be considered a reliable source of information. They hold various information about which syscalls generated events, use of internal Tetragon buffers, errors and more. - execve This event is generated by an execve syscall for a new process. See procFs for the other option. A correctly formatted event should either set execve or procFS (described next). - procFS This event is generated from a proc interface. This happens at Tetragon init when existing processes are being loaded into Tetragon event buffer. All events should have either execve or procFS set. - truncFilename Indicates a truncated processes filename because the buffer size is too small to contain the process filename. Consider increasing buffer size to avoid this. - truncArgs Indicates truncated the processes arguments because the buffer size was too small to contain all exec args. Consider increasing buffer size to avoid this. - taskWalk Primarily useful for debugging. Indicates a walked process hierarchy to find a parent process in the Tetragon buffer. This may happen when we did not receive an exec event for the immediate parent of a process. Typically means we are looking at a fork that in turn did another fork we don't currently track fork events exactly and instead push an event with the original parent exec data. This flag can provide this insight into the event if needed. - miss An error flag indicating we could not find parent info in the Tetragon event buffer. If this is set it should be reported to Tetragon developers for debugging. Tetragon will do its best to recover information about the process from available kernel data structures instead of using cached info in this case. However, args will not be available. - needsAUID An internal flag for Tetragon to indicate the audit has not yet been resolved. The BPF hooks look at this flag to determine if probing the audit system is necessary. - errorFilename An error flag indicating an error happened while reading the filename. If this is set it should be reported to Tetragon developers for debugging. - errorArgs An error flag indicating an error happened while reading the process args. If this is set it should be reported to Tetragon developers for debugging - needsCWD An internal flag for Tetragon to indicate the current working directory has not yet been resolved. The Tetragon hooks look at this flag to determine if probing the CWD is necessary. - noCWDSupport Indicates that CWD is removed from the event because the buffer size is too small. Consider increasing buffer size to avoid this. - rootCWD Indicates that CWD is the root directory. This is necessary to inform readers the CWD is not in the event buffer and is '/' instead. - errorCWD An error flag indicating an error occurred while reading the CWD of a process. If this is set it should be reported to Tetragon developers for debugging. - clone Indicates the process issued a clone before exec*. This is the general flow to exec* a new process, however its possible to replace the current process with a new process by doing an exec* without a clone. In this case the flag will be omitted and the same PID will be used by the kernel for both the old process and the newly exec'd process. - unknown Indicates the process was not found in the process cache and contains just pid and start time. | |
| start_time | google.protobuf.Timestamp | Start time of the execution. | |
| auid | google.protobuf.UInt32Value | Audit user ID, this ID is assigned to a user upon login and is inherited by every process even when the user's identity changes. For example, by switching user accounts with su - john. | |
| pod | Pod | Information about the the Kubernetes Pod where the event originated. | |
| docker | string | The 15 first digits of the container ID. | |
| parent_exec_id | string | Exec ID of the parent process. | |
| refcnt | uint32 | Reference counter from the Tetragon process cache. | |
| cap | Capabilities | Set of capabilities that define the permissions the process can execute with. | |
| ns | Namespaces | Linux namespaces of the process, disabled by default, can be enabled by the --enable-process-ns flag. | |
| tid | google.protobuf.UInt32Value | Thread ID, note that for the thread group leader, tid is equal to pid. | |
| process_credentials | ProcessCredentials | Process credentials, disabled by default, can be enabled by the --enable-process-cred flag. | |
| binary_properties | BinaryProperties | Executed binary properties. This field is only available on ProcessExec events. | |
| user | UserRecord | UserRecord contains user information about the event. It is only supported when i) Tetragon is running as a systemd service or directly on the host, and ii) when the flag --username-metadata is set to "unix". In this case, the information is retrieved from the traditional user database /etc/passwd and no name services lookups are performed. The resolution will only be attempted for processes in the host namespace. Note that this resolution happens in user-space, which means that mapping might have changed between the in-kernel BPF hook being executed and the username resolution. | |
| in_init_tree | google.protobuf.BoolValue | If set to true, this process is containerized and is a member of the process tree rooted at pid=1 in its PID namespace. This is useful if, for example, you wish to discern whether a process was spawned using a tool like nsenter or kubectl exec. | |
| environment_variables | EnvVar | repeated | Environment variables passed to the binary at execution. |
| Field | Type | Label | Description |
|---|---|---|---|
| uid | google.protobuf.UInt32Value | The real user ID of the process' owner. | |
| gid | google.protobuf.UInt32Value | The real group ID of the process' owner. | |
| euid | google.protobuf.UInt32Value | The effective user ID used for permission checks. | |
| egid | google.protobuf.UInt32Value | The effective group ID used for permission checks. | |
| suid | google.protobuf.UInt32Value | The saved user ID. | |
| sgid | google.protobuf.UInt32Value | The saved group ID. | |
| fsuid | google.protobuf.UInt32Value | the filesystem user ID used for filesystem access checks. Usually equals the euid. | |
| fsgid | google.protobuf.UInt32Value | The filesystem group ID used for filesystem access checks. Usually equals the egid. | |
| securebits | SecureBitsType | repeated | Secure management flags |
| caps | Capabilities | Set of capabilities that define the permissions the process can execute with. | |
| user_ns | UserNamespace | User namespace where the UIDs, GIDs and capabilities are relative to. |
| Field | Type | Label | Description |
|---|---|---|---|
| process | Process | Process that triggered the exec. | |
| parent | Process | Immediate parent of the process. | |
| ancestors | Process | repeated | Ancestors of the process beyond the immediate parent. |
| Field | Type | Label | Description |
|---|---|---|---|
| process | Process | Process that triggered the exit. | |
| parent | Process | Immediate parent of the process. | |
| signal | string | Signal that the process received when it exited, for example SIGKILL or SIGTERM (list all signal names with kill -l). If there is no signal handler implemented for a specific process, we report the exit status code that can be found in the status field. | |
| status | uint32 | Status code on process exit. For example, the status code can indicate if an error was encountered or the program exited successfully. | |
| time | google.protobuf.Timestamp | Date and time of the event. | |
| ancestors | Process | repeated | Ancestors of the process beyond the immediate parent. |
| Field | Type | Label | Description |
|---|---|---|---|
| process | Process | Process that triggered the kprobe. | |
| parent | Process | Immediate parent of the process. | |
| function_name | string | Symbol on which the kprobe was attached. | |
| args | KprobeArgument | repeated | Arguments definition of the observed kprobe. |
| return | KprobeArgument | Return value definition of the observed kprobe. | |
| action | KprobeAction | Action performed when the kprobe matched. | |
| kernel_stack_trace | StackTraceEntry | repeated | Kernel stack trace to the call. |
| policy_name | string | Name of the Tracing Policy that created that kprobe. | |
| return_action | KprobeAction | Action performed when the return kprobe executed. | |
| message | string | Short message of the Tracing Policy to inform users what is going on. | |
| tags | string | repeated | Tags of the Tracing Policy to categorize the event. |
| user_stack_trace | StackTraceEntry | repeated | User-mode stack trace to the call. |
| ancestors | Process | repeated | Ancestors of the process beyond the immediate parent. |
| data | KprobeArgument | repeated | Data definition of the observed kprobe. |
loader sensor event triggered for loaded binary/library
| Field | Type | Label | Description |
|---|---|---|---|
| process | Process | Process that triggered the loader. | |
| path | string | File path that is being loaded. | |
| buildid | bytes | Buildid of the file that is being loaded. | |
| parent | Process | Immediate parent of the process. | |
| ancestors | Process | repeated | Ancestors of the process beyond the immediate parent. |
| Field | Type | Label | Description |
|---|---|---|---|
| process | Process | ||
| parent | Process | ||
| function_name | string | LSM hook name. | |
| policy_name | string | Name of the policy that created that LSM hook. | |
| message | string | Short message of the Tracing Policy to inform users what is going on. | |
| args | KprobeArgument | repeated | Arguments definition of the observed LSM hook. |
| action | KprobeAction | Action performed when the LSM hook matched. | |
| tags | string | repeated | Tags of the Tracing Policy to categorize the event. |
| ancestors | Process | repeated | Ancestors of the process beyond the immediate parent. |
| ima_hash | string | IMA file hash. Format algorithm:value. |
| Field | Type | Label | Description |
|---|---|---|---|
| process | Process | Process that triggered the tracepoint. | |
| parent | Process | Immediate parent of the process. | |
| subsys | string | Subsystem of the tracepoint. | |
| event | string | Event of the subsystem. | |
| args | KprobeArgument | repeated | Arguments definition of the observed tracepoint. TODO: once we implement all we want, rename KprobeArgument to GenericArgument |
| policy_name | string | Name of the policy that created that tracepoint. | |
| action | KprobeAction | Action performed when the tracepoint matched. | |
| message | string | Short message of the Tracing Policy to inform users what is going on. | |
| tags | string | repeated | Tags of the Tracing Policy to categorize the event. |
| ancestors | Process | repeated | Ancestors of the process beyond the immediate parent. |
| Field | Type | Label | Description |
|---|---|---|---|
| process | Process | ||
| parent | Process | ||
| path | string | ||
| symbol | string | ||
| policy_name | string | Name of the policy that created that uprobe. | |
| message | string | Short message of the Tracing Policy to inform users what is going on. | |
| args | KprobeArgument | repeated | Arguments definition of the observed uprobe. |
| tags | string | repeated | Tags of the Tracing Policy to categorize the event. |
| ancestors | Process | repeated | Ancestors of the process beyond the immediate parent. |
| offset | uint64 | uprobe offset (mutualy exclusive with symbol) | |
| ref_ctr_offset | uint64 | uprobe ref_ctr_offset | |
| action | KprobeAction | Action performed when the uprobe hook matched. | |
| data | KprobeArgument | repeated | Data definition of the observed uprobe. |
| Field | Type | Label | Description |
|---|---|---|---|
| process | Process | ||
| parent | Process | ||
| path | string | ||
| provider | string | ||
| name | string | ||
| policy_name | string | Name of the policy that created that uprobe. | |
| message | string | Short message of the Tracing Policy to inform users what is going on. | |
| args | KprobeArgument | repeated | Arguments definition of the observed uprobe. |
| tags | string | repeated | Tags of the Tracing Policy to categorize the event. |
| ancestors | Process | repeated | Ancestors of the process beyond the immediate parent. |
| action | KprobeAction | Action performed when the USDT hook matched. | |
| flags | string | Flags are for debugging purposes only and should not be considered a reliable source of information. |
RuntimeHookRequest synchronously propagates information to the agent about run-time state.
| Field | Type | Label | Description |
|---|---|---|---|
| createContainer | CreateContainer |
| Field | Type | Label | Description |
|---|---|---|---|
| privileged | bool | True if this container is priviledged. |
| Field | Type | Label | Description |
|---|---|---|---|
| address | uint64 | linear address of the function in kernel or user space. | |
| offset | uint64 | offset is the offset into the native instructions for the function. | |
| symbol | string | symbol is the symbol name of the function. | |
| module | string | module path for user space addresses. |
| Field | Type | Label | Description |
|---|---|---|---|
| id | uint32 | ||
| abi | string |
| Field | Type | Label | Description |
|---|---|---|---|
| arg0 | uint64 | ||
| arg1 | uint64 | ||
| arg2 | uint64 | ||
| arg3 | uint64 |
| Field | Type | Label | Description |
|---|---|---|---|
| level | google.protobuf.Int32Value | Nested level of the user namespace. Init or host user namespace is at level 0. | |
| uid | google.protobuf.UInt32Value | The owner user ID of the namespace | |
| gid | google.protobuf.UInt32Value | The owner group ID of the namepace. | |
| ns | Namespace | The user namespace details that include the inode number of the namespace. |
User records
| Field | Type | Label | Description |
|---|---|---|---|
| name | string | The UNIX username for this record. Corresponds to pw_name field of struct passwd and the sp_namp field of struct spwd. |
| Name | Number | Description |
|---|---|---|
| HEALTH_STATUS_UNDEF | 0 | |
| HEALTH_STATUS_RUNNING | 1 | |
| HEALTH_STATUS_STOPPED | 2 | |
| HEALTH_STATUS_ERROR | 3 |
| Name | Number | Description |
|---|---|---|
| HEALTH_STATUS_TYPE_UNDEF | 0 | |
| HEALTH_STATUS_TYPE_STATUS | 1 |
| Name | Number | Description |
|---|---|---|
| KPROBE_ACTION_UNKNOWN | 0 | Unknown action |
| KPROBE_ACTION_POST | 1 | Post action creates an event (default action). |
| KPROBE_ACTION_FOLLOWFD | 2 | Post action creates a mapping between file descriptors and file names. Deprecated and no more supported. |
| KPROBE_ACTION_SIGKILL | 3 | Sigkill action synchronously terminates the process. |
| KPROBE_ACTION_UNFOLLOWFD | 4 | Post action removes a mapping between file descriptors and file names. Deprecated and no more supported. |
| KPROBE_ACTION_OVERRIDE | 5 | Override action modifies the return value of the call. |
| KPROBE_ACTION_COPYFD | 6 | Post action dupplicates a mapping between file descriptors and file names. Deprecated and no more supported. |
| KPROBE_ACTION_GETURL | 7 | GetURL action issue an HTTP Get request against an URL from userspace. |
| KPROBE_ACTION_DNSLOOKUP | 8 | GetURL action issue a DNS lookup against an URL from userspace. |
| KPROBE_ACTION_NOPOST | 9 | NoPost action suppresses the transmission of the event to userspace. |
| KPROBE_ACTION_SIGNAL | 10 | Signal action sends specified signal to the process. |
| KPROBE_ACTION_TRACKSOCK | 11 | TrackSock action tracks socket. |
| KPROBE_ACTION_UNTRACKSOCK | 12 | UntrackSock action un-tracks socket. |
| KPROBE_ACTION_NOTIFYENFORCER | 13 | NotifyEnforcer action notifies enforcer sensor. |
| KPROBE_ACTION_CLEANUPENFORCERNOTIFICATION | 14 | CleanupEnforcerNotification action cleanups any state left by NotifyEnforcer |
| KPROBE_ACTION_SET | 15 | Set action sets first USDT argument |
Tainted bits to indicate if the kernel was tainted. For further details: https://docs.kernel.org/admin-guide/tainted-kernels.html
| Name | Number | Description |
|---|---|---|
| TAINT_UNSET | 0 | |
| TAINT_PROPRIETARY_MODULE | 1 | A proprietary module was loaded. |
| TAINT_FORCED_MODULE | 2 | A module was force loaded. |
| TAINT_FORCED_UNLOAD_MODULE | 4 | A module was force unloaded. |
| TAINT_STAGED_MODULE | 1024 | A staging driver was loaded. |
| TAINT_OUT_OF_TREE_MODULE | 4096 | An out of tree module was loaded. |
| TAINT_UNSIGNED_MODULE | 8192 | An unsigned module was loaded. Supported only on kernels built with CONFIG_MODULE_SIG option. |
| TAINT_KERNEL_LIVE_PATCH_MODULE | 32768 | The kernel has been live patched. |
| TAINT_TEST_MODULE | 262144 | Loading a test module. |
AggregationInfo contains information about aggregation results.
| Field | Type | Label | Description |
|---|---|---|---|
| count | uint64 | Total count of events in this aggregation time window. |
AggregationOptions defines configuration options for aggregating events.
| Field | Type | Label | Description |
|---|---|---|---|
| window_size | google.protobuf.Duration | Aggregation window size. Defaults to 15 seconds if this field is not set. | |
| channel_buffer_size | uint64 | Size of the buffer for the aggregator to receive incoming events. If the buffer becomes full, the aggregator will log a warning and start dropping incoming events. |
Filter over a set of Linux process capabilities. See message Capabilities
for more info. WARNING: Multiple sets are ANDed. For example, if the
permitted filter matches, but the effective filter does not, the filter will
NOT match.
| Field | Type | Label | Description |
|---|---|---|---|
| permitted | CapFilterSet | Filter over the set of permitted capabilities. | |
| effective | CapFilterSet | Filter over the set of effective capabilities. | |
| inheritable | CapFilterSet | Filter over the set of inheritable capabilities. |
Capability set to filter over. NOTE: you may specify only ONE set here.
| Field | Type | Label | Description |
|---|---|---|---|
| any | CapabilitiesType | repeated | Match if the capability set contains any of the capabilities defined in this filter. |
| all | CapabilitiesType | repeated | Match if the capability set contains all of the capabilities defined in this filter. |
| exactly | CapabilitiesType | repeated | Match if the capability set exactly matches all of the capabilities defined in this filter. |
| none | CapabilitiesType | repeated | Match if the capability set contains none of the capabilities defined in this filter. |
| Field | Type | Label | Description |
|---|---|---|---|
| event_set | EventType | repeated | Event types to filter or undefined to filter over all event types. |
| fields | google.protobuf.FieldMask | Fields to include or exclude. | |
| action | FieldFilterAction | Whether to include or exclude fields. | |
| invert_event_set | google.protobuf.BoolValue | Whether or not the event set filter should be inverted. |
| Field | Type | Label | Description |
|---|---|---|---|
| binary_regex | string | repeated | |
| namespace | string | repeated | |
| health_check | google.protobuf.BoolValue | ||
| pid | uint32 | repeated | |
| pid_set | uint32 | repeated | Filter by the PID of a process and any of its descendants. Note that this filter is intended for testing and development purposes only and should not be used in production. In particular, PID cycling in the OS over longer periods of time may cause unexpected events to pass this filter. |
| event_set | EventType | repeated | |
| pod_regex | string | repeated | Filter by process.pod.name field using RE2 regular expression syntax: https://github.com/google/re2/wiki/Syntax |
| arguments_regex | string | repeated | Filter by process.arguments field using RE2 regular expression syntax: https://github.com/google/re2/wiki/Syntax |
| labels | string | repeated | Filter events by pod labels using Kubernetes label selector syntax: https://kubernetes.io/docs/concepts/overview/working-with-objects/labels/#label-selectors Note that this filter never matches events without the pod field (i.e. host process events). |
| policy_names | string | repeated | Filter events by tracing policy names |
| capabilities | CapFilter | Filter events by Linux process capability | |
| parent_binary_regex | string | repeated | Filter parent process' binary using RE2 regular expression syntax. |
| cel_expression | string | repeated | Filter using CEL expressions. CEL filters support IP and CIDR notiation extensions from the k8s project. See https://pkg.go.dev/k8s.io/apiserver/pkg/cel/library#IP and https://pkg.go.dev/k8s.io/apiserver/pkg/cel/library#CIDR for details. |
| parent_arguments_regex | string | repeated | Filter by process.parent.arguments field using RE2 regular expression syntax: https://github.com/google/re2/wiki/Syntax |
| container_id | string | repeated | Filter by the container ID in the process.docker field using RE2 regular expression syntax: https://github.com/google/re2/wiki/Syntax |
| in_init_tree | google.protobuf.BoolValue | Filter containerized processes based on whether they are descendants of the container's init process. This can be used, for example, to watch for processes injected into a container via docker exec, kubectl exec, or similar mechanisms. | |
| ancestor_binary_regex | string | repeated | Filter ancestor processes' binaries using RE2 regular expression syntax. |
| container_name_regex | string | repeated | Filter by the container name in the process.pod.container field using RE2 regular expression syntax: https://github.com/google/re2/wiki/Syntax |
| namespace_regex | string | repeated | Filter by the namespace in the process.pod.namespace field using RE2 regular expression syntax: https://github.com/google/re2/wiki/Syntax |
| Field | Type | Label | Description |
|---|---|---|---|
| allow_list | Filter | repeated | allow_list specifies a list of filters to apply to only return certain events. If multiple filters are specified, at least one of them has to match for an event to be included in the results. |
| deny_list | Filter | repeated | deny_list specifies a list of filters to apply to exclude certain events from the results. If multiple filters are specified, at least one of them has to match for an event to be excluded. If both allow_list and deny_list are specified, the results contain the set difference allow_list - deny_list. |
| aggregation_options | AggregationOptions | aggregation_options configures aggregation options for this request. If this field is not set, responses will not be aggregated. Note that currently only process_accept and process_connect events are aggregated. Other events remain unaggregated. | |
| field_filters | FieldFilter | repeated | Fields to include or exclude for events in the GetEventsResponse. Omitting this field implies that all fields will be included. Exclusion always takes precedence over inclusion in the case of conflicts. |
| Field | Type | Label | Description |
|---|---|---|---|
| process_exec | ProcessExec | ProcessExec event includes information about the execution of binaries and other related process metadata. | |
| process_exit | ProcessExit | ProcessExit event indicates how and when a process terminates. | |
| process_kprobe | ProcessKprobe | ProcessKprobe event contains information about the pre-defined functions and the process that invoked them. | |
| process_tracepoint | ProcessTracepoint | ProcessTracepoint contains information about the pre-defined tracepoint and the process that invoked them. | |
| process_loader | ProcessLoader | ||
| process_uprobe | ProcessUprobe | ||
| process_throttle | ProcessThrottle | ||
| process_lsm | ProcessLsm | ||
| process_usdt | ProcessUsdt | ||
| test | Test | ||
| rate_limit_info | RateLimitInfo | ||
| node_name | string | Name of the node where this event was observed. | |
| time | google.protobuf.Timestamp | Timestamp at which this event was observed. For an aggregated response, this field to set to the timestamp at which the event was observed for the first time in a given aggregation time window. | |
| aggregation_info | AggregationInfo | aggregation_info contains information about aggregation results. This field is set only for aggregated responses. | |
| cluster_name | string | Name of the cluster where this event was observed. | |
| node_labels | GetEventsResponse.NodeLabelsEntry | repeated | Labels associated with the node where this event was observed. |
| Field | Type | Label | Description |
|---|---|---|---|
| key | string | ||
| value | string |
| Field | Type | Label | Description |
|---|---|---|---|
| type | ThrottleType | Throttle type | |
| cgroup | string | Cgroup name |
| Field | Type | Label | Description |
|---|---|---|---|
| number_of_dropped_process_events | uint64 |
| Field | Type | Label | Description |
|---|---|---|---|
| match | Filter | repeated | Deprecated. Deprecated, do not use. |
| redact | string | repeated | RE2 regular expressions to use for redaction. Strings inside capture groups are redacted. |
| binary_regex | string | repeated | RE2 regular expression to match binary name. If supplied, redactions will only be applied to matching processes. |
Represents the type of a Tetragon event.
NOTE: EventType constants must be in sync with the numbers used in the GetEventsResponse event oneof.
| Name | Number | Description |
|---|---|---|
| UNDEF | 0 | |
| PROCESS_EXEC | 1 | |
| PROCESS_EXIT | 5 | |
| PROCESS_KPROBE | 9 | |
| PROCESS_TRACEPOINT | 10 | |
| PROCESS_LOADER | 11 | |
| PROCESS_UPROBE | 12 | |
| PROCESS_THROTTLE | 27 | |
| PROCESS_LSM | 28 | |
| PROCESS_USDT | 29 | |
| TEST | 40000 | |
| RATE_LIMIT_INFO | 40001 |
Determines the behavior of a field filter
| Name | Number | Description |
|---|---|---|
| INCLUDE | 0 | |
| EXCLUDE | 1 |
| Name | Number | Description |
|---|---|---|
| THROTTLE_UNKNOWN | 0 | |
| THROTTLE_START | 1 | |
| THROTTLE_STOP | 2 |
| Field | Type | Label | Description |
|---|---|---|---|
| yaml | string | ||
| domain | string |
| Field | Type | Label | Description |
|---|---|---|---|
| name | string | ||
| namespace | string | ||
| enable | bool | optional | |
| mode | TracingPolicyMode | optional | |
| domain | string |
| Field | Type | Label | Description |
|---|---|---|---|
| name | string | ||
| namespace | string | ||
| domain | string |
| Field | Type | Label | Description |
|---|---|---|---|
| name | string |
| Field | Type | Label | Description |
|---|---|---|---|
| name | string | ||
| namespace | string | ||
| domain | string |
| Field | Type | Label | Description |
|---|---|---|---|
| skip_zero_refcnt | bool | ||
| exclude_execve_map_processes | bool |
| Field | Type | Label | Description |
|---|---|---|---|
| processes | ProcessInternal | repeated |
| Field | Type | Label | Description |
|---|---|---|---|
| name | string |
| Field | Type | Label | Description |
|---|---|---|---|
| name | string | ||
| namespace | string | ||
| domain | string |
| Field | Type | Label | Description |
|---|---|---|---|
| flag | ConfigFlag | ||
| dump | DumpProcessCacheReqArgs |
| Field | Type | Label | Description |
|---|---|---|---|
| flag | ConfigFlag | ||
| level | LogLevel | ||
| processes | DumpProcessCacheResArgs |
| Field | Type | Label | Description |
|---|---|---|---|
| version | string | version is the version of the agent tetragon (same as GetVersionResponse()) | |
| name | string | name is the name of the agent | |
| probes | GetInfoResponse.Probe | repeated | probes is a list of kernel features that have been probed by the agent |
| conf | GetInfoResponse.ConfVal | repeated | conf is the agent configuration |
| build | GetInfoResponse.BuildInfo | build is the agent build information |
| Field | Type | Label | Description |
|---|---|---|---|
| go_version | string | ||
| commit | string | ||
| time | string | ||
| modified | string |
| Field | Type | Label | Description |
|---|---|---|---|
| key | string | ||
| value | google.protobuf.Any |
| Field | Type | Label | Description |
|---|---|---|---|
| Name | string | ||
| Enabled | google.protobuf.BoolValue |
| Field | Type | Label | Description |
|---|---|---|---|
| version | string |
| Field | Type | Label | Description |
|---|---|---|---|
| section | string | hook's section within the policy | |
| state | HookState | hook state | |
| hook_description | string | description of hook | |
| hook_idx | uint32 | the index at which this hook is configured within its section |
| Field | Type | Label | Description |
|---|---|---|---|
| domains | string | repeated |
| Field | Type | Label | Description |
|---|---|---|---|
| sensors | SensorStatus | repeated |
| Field | Type | Label | Description |
|---|---|---|---|
| domain | string | domain to be listed; empty to list all domains |
| Field | Type | Label | Description |
|---|---|---|---|
| policies | TracingPolicyStatus | repeated |
| Field | Type | Label | Description |
|---|---|---|---|
| process | Process | ||
| color | string | ||
| refcnt | google.protobuf.UInt32Value | ||
| refcnt_ops | ProcessInternal.RefcntOpsEntry | repeated | refcnt_ops is a map of operations to refcnt change keys can be: - "process++": process increased refcnt (i.e. this process starts) - "process–": process decreased refcnt (i.e. this process exits) - "parent++": parent increased refcnt (i.e. a process starts that has this process as a parent) - "parent–": parent decreased refcnt (i.e. a process exits that has this process as a parent) - "ancestor++": ancestor increased refcnt (i.e. a process starts that has this process as an ancestor) - "ancestor–": ancestor decreased refcnt (i.e. a process exits that has this process as an ancestor) |
| Field | Type | Label | Description |
|---|---|---|---|
| key | string | ||
| value | int32 |
| Field | Type | Label | Description |
|---|---|---|---|
| name | string |
| Field | Type | Label | Description |
|---|---|---|---|
| name | string | name is the name of the sensor | |
| enabled | bool | enabled marks whether the sensor is enabled | |
| collection | string | collection is the collection the sensor belongs to (typically a tracing policy) |
| Field | Type | Label | Description |
|---|---|---|---|
| flag | ConfigFlag | ||
| level | LogLevel |
| Field | Type | Label | Description |
|---|---|---|---|
| flag | ConfigFlag | ||
| level | LogLevel |
| Field | Type | Label | Description |
|---|---|---|---|
| post | uint64 | number of post events generated from the policy | |
| signal | uint64 | number of signals sent from the policy | |
| monitor_signal | uint64 | number of signals that were not sent because the policy was in monitor mode | |
| override | uint64 | number of return overrides | |
| monitor_override | uint64 | number of return overrides that did not occur because the policy was in monitor mode | |
| notify_enforcer | uint64 | number of enforcer notifications triggered from the policy | |
| monitor_notify_enforcer | uint64 | number of enforcer notifications that did not occur because the policy was in monitor mode | |
| set | uint64 | number of set actions triggered from the policy | |
| monitor_set | uint64 | number of set actions that did not occur because the policy was in monitor mode | |
| nopost | uint64 | number of events suppressed by NoPost actions |
| Field | Type | Label | Description |
|---|---|---|---|
| hook | string | hook is the policy hook that owns the selector | |
| hook_index | google.protobuf.UInt32Value | hook_index is the hook index withing a policy | |
| selector_index | google.protobuf.UInt32Value | selector_index is the selector index within the hook | |
| action_counters | TracingPolicyActionCounters | action counters for the selector | |
| selector_label | string | selector_label is an optional user-provided selector label |
| Field | Type | Label | Description |
|---|---|---|---|
| action_counters | TracingPolicyActionCounters | ||
| selector_action_counters | TracingPolicySelectorActionCounters | repeated |
| Field | Type | Label | Description |
|---|---|---|---|
| id | uint64 | id is the id of the policy | |
| name | string | name is the name of the policy | |
| namespace | string | namespace is the namespace of the policy (or empty of the policy is global) | |
| info | string | info is additional information about the policy | |
| sensors | string | repeated | sensors loaded in the scope of this policy |
| enabled | bool | Deprecated. indicating if the policy is enabled. Deprecated: use 'state' instead. | |
| filter_id | uint64 | filter ID of the policy used for k8s filtering | |
| error | string | potential error of the policy | |
| state | TracingPolicyState | current state of the tracing policy | |
| kernel_memory_bytes | uint64 | the amount of kernel memory in bytes used by policy's sensors non-shared BPF maps (memlock) | |
| mode | TracingPolicyMode | current mode of the tracing policy | |
| stats | TracingPolicyStats | optional | stats of the tracing policy |
| domain | string | domain of the policy | |
| hook_statuses | HookStatus | repeated | status of policy's hooks |
For now, we only want to support debug-related config flags to be configurable.
| Name | Number | Description |
|---|---|---|
| CONFIG_FLAG_LOG_LEVEL | 0 | |
| CONFIG_FLAG_DUMP_PROCESS_CACHE | 1 |
| Name | Number | Description |
|---|---|---|
| STATUS_UNSPECIFIED | 0 | unknown or unspecified state |
| STATUS_LOADED | 1 | probe was loaded |
| STATUS_DIGEST_REJECTED | 2 | probe was not loaded due to digest mismatch |
| STATUS_CALL_NOT_FOUND | 3 | probe was not loaded due to call was not found |
| STATUS_PARTIAL_CALL_NOT_FOUND | 4 | probe was partially loaded due to call not found |
| Name | Number | Description |
|---|---|---|
| LOG_LEVEL_PANIC | 0 | |
| LOG_LEVEL_FATAL | 1 | |
| LOG_LEVEL_ERROR | 2 | |
| LOG_LEVEL_WARN | 3 | |
| LOG_LEVEL_INFO | 4 | |
| LOG_LEVEL_DEBUG | 5 | |
| LOG_LEVEL_TRACE | 6 |
| Name | Number | Description |
|---|---|---|
| TP_MODE_UNKNOWN | 0 | |
| TP_MODE_ENFORCE | 1 | |
| TP_MODE_MONITOR | 2 | |
| TP_MODE_MONITOR_ONLY | 3 |
| Name | Number | Description |
|---|---|---|
| TP_STATE_UNKNOWN | 0 | unknown state |
| TP_STATE_ENABLED | 1 | loaded and enabled |
| TP_STATE_DISABLED | 2 | loaded but disabled |
| TP_STATE_LOAD_ERROR | 3 | failed to load |
| TP_STATE_ERROR | 4 | failed during lifetime |
| TP_STATE_LOADING | 5 | in the process of loading |
| TP_STATE_UNLOADING | 6 | in the process of unloading |
| TP_STATE_SKIPPED | 7 | tracked but not loaded on this node, e.g. its nodeSelector does not match |
| TP_STATE_PARTIALLY_ENABLED | 8 | some hooks were not loaded |
| .proto Type | Notes | C++ | Java | Python | Go | C# | PHP | Ruby |
|---|---|---|---|---|---|---|---|---|
| double | double | double | float | float64 | double | float | Float | |
| float | float | float | float | float32 | float | float | Float | |
| int32 | Uses variable-length encoding. Inefficient for encoding negative numbers – if your field is likely to have negative values, use sint32 instead. | int32 | int | int | int32 | int | integer | Bignum or Fixnum (as required) |
| int64 | Uses variable-length encoding. Inefficient for encoding negative numbers – if your field is likely to have negative values, use sint64 instead. | int64 | long | int/long | int64 | long | integer/string | Bignum |
| uint32 | Uses variable-length encoding. | uint32 | int | int/long | uint32 | uint | integer | Bignum or Fixnum (as required) |
| uint64 | Uses variable-length encoding. | uint64 | long | int/long | uint64 | ulong | integer/string | Bignum or Fixnum (as required) |
| sint32 | Uses variable-length encoding. Signed int value. These more efficiently encode negative numbers than regular int32s. | int32 | int | int | int32 | int | integer | Bignum or Fixnum (as required) |
| sint64 | Uses variable-length encoding. Signed int value. These more efficiently encode negative numbers than regular int64s. | int64 | long | int/long | int64 | long | integer/string | Bignum |
| fixed32 | Always four bytes. More efficient than uint32 if values are often greater than 2^28. | uint32 | int | int | uint32 | uint | integer | Bignum or Fixnum (as required) |
| fixed64 | Always eight bytes. More efficient than uint64 if values are often greater than 2^56. | uint64 | long | int/long | uint64 | ulong | integer/string | Bignum |
| sfixed32 | Always four bytes. | int32 | int | int | int32 | int | integer | Bignum or Fixnum (as required) |
| sfixed64 | Always eight bytes. | int64 | long | int/long | int64 | long | integer/string | Bignum |
| bool | bool | boolean | boolean | bool | bool | boolean | TrueClass/FalseClass | |
| string | A string must always contain UTF-8 encoded or 7-bit ASCII text. | string | String | str/unicode | string | string | string | String (UTF-8) |
| bytes | May contain any arbitrary sequence of bytes. | string | ByteString | str | []byte | ByteString | string | String (ASCII-8BIT) |
tetragon_bpf_error_metrics_totalThe total and type of errors encountered exposed via the BPF error metrics API. Internal use only.
| label | values |
|---|---|
error | 22 |
error_name | EINVAL |
file_name | bpf_d_path.h |
helper_func | FnProbeRead |
line_number | 166 |
tetragon_bpf_missed_events_totalNumber of Tetragon perf events that are failed to be sent from the kernel.
| label | values |
|---|---|
error | E2BIG, EAGAIN, EBUSY, EINVAL, ENOENT, ENOSPC, unknown |
msg_op | 13, 14, 15, 16, 23, 24, 25, 26, 27, 28, 5, 7 |
tetragon_build_infoBuild information about tetragon
| label | values |
|---|---|
commit | 931b70f2c9878ba985ba6b589827bea17da6ec33 |
go_version | go1.26.5 |
modified | false |
time | 2022-05-13T15:54:45Z |
version | v1.2.0 |
tetragon_cgroup_rate_totalThe total number of Tetragon cgroup rate counters. For internal use only.
| label | values |
|---|---|
type | check, delete, delete_fail, lookup_fail, process, throttle_start, throttle_stop, update_fail |
tetragon_cri_cgidmap_resolutions_errors_totalnumber of cgroup id map (cgidmap) CRI resolutions that failed
tetragon_cri_cgidmap_resolutions_totalnumber of total cgroup id map (cgidmap) CRI resolutions
tetragon_data_cache_capacityThe capacity of the data cache.
tetragon_data_cache_evictions_totalNumber of data cache LRU evictions.
tetragon_data_cache_misses_totalNumber of data cache misses.
| label | values |
|---|---|
operation | get, remove |
tetragon_data_cache_sizeThe size of the data cache
tetragon_data_event_sizeThe size of received data events.
| label | values |
|---|---|
op | bad, ok |
tetragon_data_events_totalThe number of data events by type. For internal use only.
| label | values |
|---|---|
event | Added, Appended, Bad, Matched, NotMatched, Received |
tetragon_debug_events_totalThe total number of Tetragon debug events. For internal use only.
| label | values |
|---|---|
type | process_metadata_username_ignored_not_in_host_namespaces |
tetragon_enforcer_missed_notifications_totalThe number of missed notifications by the enforcer.
| label | values |
|---|---|
info | syscall |
policy | policy-name |
reason | reason |
tetragon_errors_totalThe total number of Tetragon errors. For internal use only.
| label | values |
|---|---|
error | event_finalize_process_info_failed, process_metadata_username_failed, process_pid_tid_mismatch_clone, process_pid_tid_mismatch_exec, process_pid_tid_mismatch_exit |
tetragon_event_cache_entriesThe number of entries in the event cache.
tetragon_event_cache_errors_totalThe total of errors encountered while fetching process exec information from the cache.
| label | values |
|---|---|
error | nil_process_pid |
event_type | PROCESS_EXEC, PROCESS_EXIT, PROCESS_KPROBE, PROCESS_LOADER, PROCESS_LSM, PROCESS_THROTTLE, PROCESS_TRACEPOINT, PROCESS_UPROBE, PROCESS_USDT, RATE_LIMIT_INFO |
tetragon_event_cache_fetch_failures_totalNumber of failed fetches from the event cache. These won’t be retried as they already exceeded the limit.
| label | values |
|---|---|
entry_type | ancestors_info, parent_info, pod_info, process_info |
event_type | PROCESS_EXEC, PROCESS_EXIT, PROCESS_KPROBE, PROCESS_LOADER, PROCESS_LSM, PROCESS_THROTTLE, PROCESS_TRACEPOINT, PROCESS_UPROBE, PROCESS_USDT, RATE_LIMIT_INFO |
tetragon_event_cache_fetch_retries_totalNumber of retries when fetching info from the event cache.
| label | values |
|---|---|
entry_type | ancestors_info, parent_info, pod_info, process_info |
tetragon_event_cache_inserts_totalNumber of inserts to the event cache.
tetragon_events_exported_bytes_totalNumber of bytes exported for events
tetragon_events_exported_totalTotal number of events exported
tetragon_events_last_exported_timestampTimestamp of the most recent event to be exported
tetragon_events_missing_process_info_totalNumber of events missing process info.
tetragon_export_ratelimit_events_dropped_totalNumber of events dropped on export due to rate limiting
tetragon_flags_totalThe total number of Tetragon flags. For internal use only.
| label | values |
|---|---|
type | clone, dataArgs, dataFilename, errorArgs, errorCWD, errorCgroupID, errorCgroupName, errorCgroupSubsys, errorCgroupSubsysCgrp, errorCgroups, errorEnvs, errorFilename, errorPathResolutionCwd, execve, inInitTree, miss, nocwd, procFS, rootcwd, truncArgs, unknown |
tetragon_generic_kprobe_merge_pushed_totalThe total number of pushed events for later merge.
tetragon_generic_kprobe_merge_totalThe total number of attempts to merge a kprobe and kretprobe event.
| label | values |
|---|---|
curr_fn | example_kprobe |
curr_type | enter, exit |
prev_fn | example_kprobe |
prev_type | enter, exit |
status | error, ok |
tetragon_handler_errors_totalThe total number of event handler errors. For internal use only.
| label | values |
|---|---|
error | event_handler_failed, perf_empty_data, unknown_opcode |
opcode | 0, 13, 14, 15, 16, 23, 24, 25, 26, 27, 28, 5, 7 |
tetragon_handling_latencyThe latency of handling messages in us.
| label | values |
|---|---|
op | 13, 14, 15, 16, 23, 24, 25, 26, 27, 28, 5, 7 |
tetragon_map_capacityCapacity of a BPF map. Expected to be constant.
| label | values |
|---|---|
map | execve_map, tg_execve_joined_info_map |
tetragon_map_entriesThe total number of in-use entries per map.
| label | values |
|---|---|
map | execve_map, tg_execve_joined_info_map |
tetragon_map_errors_delete_totalThe number of failed deletes per map.
| label | values |
|---|---|
map | execve_map, tg_execve_joined_info_map |
tetragon_map_errors_update_totalThe number of failed updates per map.
| label | values |
|---|---|
map | execve_map, tg_execve_joined_info_map |
tetragon_missed_link_probes_totalThe total number of Tetragon probe missed by link.
| label | values |
|---|---|
attach | sys_panic |
policy | monitor_panic |
tetragon_missed_prog_probes_totalThe total number of Tetragon probe missed by program.
| label | values |
|---|---|
attach | sys_panic |
policy | monitor_panic |
tetragon_msg_op_totalThe total number of times we encounter a given message opcode. For internal use only.
| label | values |
|---|---|
msg_op | 13, 14, 15, 16, 23, 24, 25, 26, 27, 28, 5, 7 |
tetragon_notify_overflowed_events_totalThe total number of events dropped because listener buffer was full
tetragon_observer_ringbuf_errors_totalNumber of errors when reading Tetragon ring buffer.
tetragon_observer_ringbuf_events_lost_totalNumber of perf events Tetragon ring buffer lost.
tetragon_observer_ringbuf_events_received_totalNumber of perf events Tetragon ring buffer received.
tetragon_observer_ringbuf_queue_events_lost_totalNumber of perf events Tetragon ring buffer events queue lost.
tetragon_observer_ringbuf_queue_events_received_totalNumber of perf events Tetragon ring buffer events queue received.
tetragon_overhead_program_runs_totalThe total number of times BPF program was executed.
| label | values |
|---|---|
attach | sys_open |
policy | enforce |
policy_namespace | ns |
section | kprobe/sys_open |
sensor | generic_kprobe |
tetragon_overhead_program_seconds_totalThe total time of BPF program running.
| label | values |
|---|---|
attach | sys_open |
policy | enforce |
policy_namespace | ns |
section | kprobe/sys_open |
sensor | generic_kprobe |
tetragon_policyfilter_hook_container_image_missing_totalThe total number of operations when the container image was missing in the OCI hook
tetragon_policyfilter_hook_container_name_missing_totalThe total number of operations when the container name was missing in the OCI hook
tetragon_policyfilter_operations_totalNumber of policy filter operations.
| label | values |
|---|---|
error | generic-error, pod-namespace-conflict |
operation | add, add-container, delete, update |
subsys | pod-handlers, rthooks |
tetragon_process_cache_capacityThe capacity of the process cache. Expected to be constant.
tetragon_process_cache_early_deletions_totalNumber of times the GC attempted to delete a process already marked as deleted. May indicate the GC is deleting processes too early.
tetragon_process_cache_evictions_totalNumber of process cache LRU evictions. This includes all evictions: both explicit and capacity (implicit).
tetragon_process_cache_misses_totalNumber of process cache misses.
| label | values |
|---|---|
operation | get, remove |
tetragon_process_cache_sizeThe size of the process cache
tetragon_process_loader_statsProcess Loader event statistics. For internal use only.
| label | values |
|---|---|
count | LoaderReceived, LoaderResolvedImm, LoaderResolvedRetry |
tetragon_tracingpolicy_kernel_memory_bytesThe amount of kernel memory in bytes used by policy’s sensors non-shared BPF maps (memlock).
| label | values |
|---|---|
policy | example-tracingpolicy |
policy_namespace | example-namespace |
tetragon_tracingpolicy_loadedThe number of loaded tracing policy by state.
| label | values |
|---|---|
state | disabled, enabled, error, load_error, partially_enabled, skipped |
tetragon_tracingpolicy_selector_actions_totalThe total number of tracing policy actions observed per selector.
| label | values |
|---|---|
action | monitor_notify_enforcer, monitor_override, monitor_set, monitor_signal, nopost, notify_enforcer, override, post, set, signal |
hook | example_kprobe |
hook_index | 0 |
policy | example-tracingpolicy |
policy_namespace | example-namespace |
selector_index | 0 |
selector_label | example-selector |
tetragon_watcher_delete_pod_cache_evictionsThe total evictions from the deleted pod cache.
tetragon_watcher_delete_pod_cache_hitsThe total hits for pod information in the deleted pod cache.
tetragon_watcher_errors_totalThe total number of errors for a given watcher type.
| label | values |
|---|---|
error | failed_to_get_pod |
watcher | k8s |
tetragon_watcher_events_totalThe total number of events for a given watcher type.
| label | values |
|---|---|
watcher | k8s |
go_gc_duration_secondsA summary of the wall-time pause (stop-the-world) duration in garbage collection cycles.
go_gc_gogc_percentHeap size target percentage configured by the user, otherwise 100. This value is set by the GOGC environment variable, and the runtime/debug.SetGCPercent function. Sourced from /gc/gogc:percent.
go_gc_gomemlimit_bytesGo runtime memory limit configured by the user, otherwise math.MaxInt64. This value is set by the GOMEMLIMIT environment variable, and the runtime/debug.SetMemoryLimit function. Sourced from /gc/gomemlimit:bytes.
go_goroutinesNumber of goroutines that currently exist.
go_infoInformation about the Go environment.
| label | values |
|---|---|
version | go1.26.5 |
go_memstats_alloc_bytesNumber of bytes allocated in heap and currently in use. Equals to /memory/classes/heap/objects:bytes.
go_memstats_alloc_bytes_totalTotal number of bytes allocated in heap until now, even if released already. Equals to /gc/heap/allocs:bytes.
go_memstats_buck_hash_sys_bytesNumber of bytes used by the profiling bucket hash table. Equals to /memory/classes/profiling/buckets:bytes.
go_memstats_frees_totalTotal number of heap objects frees. Equals to /gc/heap/frees:objects + /gc/heap/tiny/allocs:objects.
go_memstats_gc_sys_bytesNumber of bytes used for garbage collection system metadata. Equals to /memory/classes/metadata/other:bytes.
go_memstats_heap_alloc_bytesNumber of heap bytes allocated and currently in use, same as go_memstats_alloc_bytes. Equals to /memory/classes/heap/objects:bytes.
go_memstats_heap_idle_bytesNumber of heap bytes waiting to be used. Equals to /memory/classes/heap/released:bytes + /memory/classes/heap/free:bytes.
go_memstats_heap_inuse_bytesNumber of heap bytes that are in use. Equals to /memory/classes/heap/objects:bytes + /memory/classes/heap/unused:bytes
go_memstats_heap_objectsNumber of currently allocated objects. Equals to /gc/heap/objects:objects.
go_memstats_heap_released_bytesNumber of heap bytes released to OS. Equals to /memory/classes/heap/released:bytes.
go_memstats_heap_sys_bytesNumber of heap bytes obtained from system. Equals to /memory/classes/heap/objects:bytes + /memory/classes/heap/unused:bytes + /memory/classes/heap/released:bytes + /memory/classes/heap/free:bytes.
go_memstats_last_gc_time_secondsNumber of seconds since 1970 of last garbage collection.
go_memstats_mallocs_totalTotal number of heap objects allocated, both live and gc-ed. Semantically a counter version for go_memstats_heap_objects gauge. Equals to /gc/heap/allocs:objects + /gc/heap/tiny/allocs:objects.
go_memstats_mcache_inuse_bytesNumber of bytes in use by mcache structures. Equals to /memory/classes/metadata/mcache/inuse:bytes.
go_memstats_mcache_sys_bytesNumber of bytes used for mcache structures obtained from system. Equals to /memory/classes/metadata/mcache/inuse:bytes + /memory/classes/metadata/mcache/free:bytes.
go_memstats_mspan_inuse_bytesNumber of bytes in use by mspan structures. Equals to /memory/classes/metadata/mspan/inuse:bytes.
go_memstats_mspan_sys_bytesNumber of bytes used for mspan structures obtained from system. Equals to /memory/classes/metadata/mspan/inuse:bytes + /memory/classes/metadata/mspan/free:bytes.
go_memstats_next_gc_bytesNumber of heap bytes when next garbage collection will take place. Equals to /gc/heap/goal:bytes.
go_memstats_other_sys_bytesNumber of bytes used for other system allocations. Equals to /memory/classes/other:bytes.
go_memstats_stack_inuse_bytesNumber of bytes obtained from system for stack allocator in non-CGO environments. Equals to /memory/classes/heap/stacks:bytes.
go_memstats_stack_sys_bytesNumber of bytes obtained from system for stack allocator. Equals to /memory/classes/heap/stacks:bytes + /memory/classes/os-stacks:bytes.
go_memstats_sys_bytesNumber of bytes obtained from system. Equals to /memory/classes/total:byte.
go_sched_gomaxprocs_threadsThe current runtime.GOMAXPROCS setting, or the number of operating system threads that can execute user-level Go code simultaneously. Sourced from /sched/gomaxprocs:threads.
go_sched_latencies_secondsDistribution of the time goroutines have spent in the scheduler in a runnable state before actually running. Bucket counts increase monotonically. Sourced from /sched/latencies:seconds.
go_threadsNumber of OS threads created.
process_cpu_seconds_totalTotal user and system CPU time spent in seconds.
process_max_fdsMaximum number of open file descriptors.
process_network_receive_bytes_totalNumber of bytes received by the process over the network.
process_network_transmit_bytes_totalNumber of bytes sent by the process over the network.
process_open_fdsNumber of open file descriptors.
process_resident_memory_bytesResident memory size in bytes.
process_start_time_secondsStart time of the process since unix epoch in seconds.
process_virtual_memory_bytesVirtual memory size in bytes.
process_virtual_memory_max_bytesMaximum amount of virtual memory available in bytes.
tetragon_events_totalThe total number of Tetragon events
| label | values |
|---|---|
binary | example-binary |
namespace | example-namespace |
node_name | example-node-name |
pod | example-pod |
type | PROCESS_EXEC, PROCESS_EXIT, PROCESS_KPROBE, PROCESS_LOADER, PROCESS_LSM, PROCESS_THROTTLE, PROCESS_TRACEPOINT, PROCESS_UPROBE, PROCESS_USDT, RATE_LIMIT_INFO |
workload | example-workload |
tetragon_policy_events_totalPolicy events calls observed.
| label | values |
|---|---|
binary | example-binary |
hook | example_kprobe |
namespace | example-namespace |
node_name | example-node-name |
pod | example-pod |
policy | example-tracingpolicy |
workload | example-workload |
tetragon_syscalls_totalSystem calls observed.
| label | values |
|---|---|
binary | example-binary |
namespace | example-namespace |
node_name | example-node-name |
pod | example-pod |
syscall | example_syscall |
workload | example-workload |
A TracingPolicy is a user-configurable Kubernetes custom resource (CR) that defines how Tetragon observes events in both the kernel and userspace using eBPF. It supports a variety of hook points including kprobes, uprobes, tracepoints, LSM hooks, and USDTs, giving users fine-grained control over what to trace and what actions to take. Policies consist of hook points, selectors for in-kernel filtering, and optional actions that can be executed when a match occurs.
Tracing policies can be loaded and unloaded dynamically at runtime or applied at startup using configuration flags. Although structured as Kubernetes CRs, they can also be used in non-Kubernetes environments via Tetragon’s CLI or daemon flags. In Kubernetes, policies can be managed using kubectl or tools like Argo CD.
Packages:
Resource Types:
| Name | Type | Description | Required |
|---|---|---|---|
| apiVersion | string | cilium.io/v1alpha1 | true |
| kind | string | TracingPolicy | true |
| metadata | object | Refer to the Kubernetes API documentation for the fields of the `metadata` field. | true |
| spec | object | Tracing policy specification. | true |
Tracing policy specification.
| Name | Type | Description | Required |
|---|---|---|---|
| containerSelector | object | ContainerSelector selects containers that this policy applies to.
A map of container fields will be constructed in the same way as a map of labels.
The name of the field represents the label "key", and the value of the field - label "value".
Currently, only the "name" field is supported. | false |
| enforcers | []object | A enforcer spec. | false |
| fentries | []object | A list of fentry specs. | false |
| hostSelector | object | HostSelector selects hosts that this policy applies to.
For now only ~ (none) and {} (all) is supported. Validations: | false |
| kprobes | []object | A list of kprobe specs. | false |
| lists | []object | A list of list specs. | false |
| loader | boolean | Enable loader events | false |
| lsmhooks | []object | A list of uprobe specs. | false |
| nodeSelector | object | NodeSelector selects the nodes, by label, on which Tetragon agents load
this policy. If empty or unset, the policy is loaded on all nodes. This differs in
purpose from hostSelector: nodeSelector controls where a policy is loaded
(on which nodes), whereas hostSelector controls which workloads a loaded
policy applies to (host vs pod workloads) and does not affect whether the
policy is loaded on a node. Use nodeSelector to target a node group such
as GPU nodes, a specific architecture or OS, or a canary pool; use
hostSelector to scope a loaded policy to host workloads. Unlike
hostSelector, nodeSelector supports arbitrary matchLabels and
matchExpressions. | false |
| options | []object | A list of overloaded options | false |
| podSelector | object | PodSelector selects pods that this policy applies to | false |
| selectorsMacros | map[string]object | SelectorsMacros is used to define selectors macros, which can be used
in probes/hooks selectors by their names. | false |
| tracepoints | []object | A list of tracepoint specs. | false |
| uprobes | []object | A list of uprobe specs. | false |
| usdts | []object | A list of usdt specs. | false |
ContainerSelector selects containers that this policy applies to. A map of container fields will be constructed in the same way as a map of labels. The name of the field represents the label “key”, and the value of the field - label “value”. Currently, only the “name” field is supported.
| Name | Type | Description | Required |
|---|---|---|---|
| matchExpressions | []object | matchExpressions is a list of label selector requirements. The requirements are ANDed. | false |
| matchLabels | map[string]string | matchLabels is a map of {key,value} pairs. A single {key,value} in the matchLabels
map is equivalent to an element of matchExpressions, whose key field is "key", the
operator is "In", and the values array contains only "value". The requirements are ANDed. | false |
A label selector requirement is a selector that contains values, a key, and an operator that relates the key and values.
| Name | Type | Description | Required |
|---|---|---|---|
| key | string | key is the label key that the selector applies to. | true |
| operator | enum | operator represents a key's relationship to a set of values.
Valid operators are In, NotIn, Exists and DoesNotExist. Enum: In, NotIn, Exists, DoesNotExist | true |
| values | []string | values is an array of string values. If the operator is In or NotIn,
the values array must be non-empty. If the operator is Exists or DoesNotExist,
the values array must be empty. This array is replaced during a strategic
merge patch. | false |
| Name | Type | Description | Required |
|---|---|---|---|
| calls | []string | Calls where enforcer is executed in | true |
| Name | Type | Description | Required |
|---|---|---|---|
| call | string | Name of the function to apply the kprobe spec to. | true |
| args | []object | A list of function arguments to include in the trace output. | false |
| data | []object | A list of data to include in the trace output. | false |
| ignore | object | Conditions for ignoring this kprobe | false |
| message | string | A short message of 256 characters max that will be included
in the event output to inform users what is going on. | false |
| return | boolean | Indicates whether to collect return value of the traced function. Default: false | false |
| returnArg | object | A return argument to include in the trace output. | false |
| returnArgAction | string | An action to perform on the return value.
Use returnArg to include the return value in the event output.
Supported actions are: TrackSock;UntrackSock | false |
| selectors | []object | Selectors to apply before producing trace output. Selectors are ORed and short-circuited. | false |
| syscall | boolean | Indicates whether the traced function is a syscall. Default: true | false |
| tags | []string | Tags to categorize the event, will be include in the event output.
Maximum of 16 Tags are supported. | false |
| Name | Type | Description | Required |
|---|---|---|---|
| index | integer | Position of the argument. Format: int32 Minimum: 0 | true |
| type | enum | Argument type. Enum: auto, int, sint8, int8, uint8, sint16, int16, uint16, uint32, sint32, int32, ulong, uint64, size_t, long, sint64, int64, char_buf, char_iovec, skb, sock, sockaddr, socket, sockaddr_un, string, fd, file, filename, path, nop, bpf_attr, perf_event, bpf_map, user_namespace, capability, kiocb, iov_iter, cred, const_buf, load_info, module, syscall64, kernel_cap_t, cap_inheritable, cap_permitted, cap_effective, linux_binprm, data_loc, net_device, bpf_cmd, dentry, bpf_prog Default: auto | true |
| btfType | string | Type to use as the initial resolve type. For kprobe args it looks up the named struct
from the kernel BTF, casting the argument's type before traversing the resolve path.
For UprobeSpecs and UsdtSpecs it looks up the type from the BTF file defined by BTFPath. | false |
| btfTypeModule | string | Kernel module that contains the BTFType. This is used only for kprobe args.
The module must already be loaded and expose BTF in /sys/kernel/btf. | false |
| label | string | Label to output in the JSON | false |
| maxData | boolean | Read maximum possible data (currently 327360). This field is only used
for char_buff data. When this value is false (default), the bpf program
will fetch at most 4096 bytes. In later kernels (>=5.4) tetragon
supports fetching up to 327360 bytes if this flag is turned on Default: false | false |
| resolve | string | Resolve the path to a specific attribute Default: | false |
| returnCopy | boolean | This field is used only for char_buf and char_iovec types. It indicates
that this argument should be read later (when the kretprobe for the
symbol is triggered) because it might not be populated when the kprobe
is triggered at the entrance of the function. For example, a buffer
supplied to read(2) won't have content until kretprobe is triggered. Default: false | false |
| sizeArgIndex | integer | Specifies the position of the corresponding size argument for this argument.
This field is used only for char_buf and char_iovec types. Format: int32 Minimum: 0 | false |
| source | string | Source of the data, if missing the default if function arguments | false |
Conditions for ignoring this kprobe
| Name | Type | Description | Required |
|---|---|---|---|
| callNotFound | boolean | Ignores calls that are not present in the system | false |
A return argument to include in the trace output.
| Name | Type | Description | Required |
|---|---|---|---|
| index | integer | Position of the argument. Format: int32 Minimum: 0 | true |
| type | enum | Argument type. Enum: auto, int, sint8, int8, uint8, sint16, int16, uint16, uint32, sint32, int32, ulong, uint64, size_t, long, sint64, int64, char_buf, char_iovec, skb, sock, sockaddr, socket, sockaddr_un, string, fd, file, filename, path, nop, bpf_attr, perf_event, bpf_map, user_namespace, capability, kiocb, iov_iter, cred, const_buf, load_info, module, syscall64, kernel_cap_t, cap_inheritable, cap_permitted, cap_effective, linux_binprm, data_loc, net_device, bpf_cmd, dentry, bpf_prog Default: auto | true |
| btfType | string | Type to use as the initial resolve type. For kprobe args it looks up the named struct
from the kernel BTF, casting the argument's type before traversing the resolve path.
For UprobeSpecs and UsdtSpecs it looks up the type from the BTF file defined by BTFPath. | false |
| btfTypeModule | string | Kernel module that contains the BTFType. This is used only for kprobe args.
The module must already be loaded and expose BTF in /sys/kernel/btf. | false |
| label | string | Label to output in the JSON | false |
| maxData | boolean | Read maximum possible data (currently 327360). This field is only used
for char_buff data. When this value is false (default), the bpf program
will fetch at most 4096 bytes. In later kernels (>=5.4) tetragon
supports fetching up to 327360 bytes if this flag is turned on Default: false | false |
| resolve | string | Resolve the path to a specific attribute Default: | false |
| returnCopy | boolean | This field is used only for char_buf and char_iovec types. It indicates
that this argument should be read later (when the kretprobe for the
symbol is triggered) because it might not be populated when the kprobe
is triggered at the entrance of the function. For example, a buffer
supplied to read(2) won't have content until kretprobe is triggered. Default: false | false |
| sizeArgIndex | integer | Specifies the position of the corresponding size argument for this argument.
This field is used only for char_buf and char_iovec types. Format: int32 Minimum: 0 | false |
| source | string | Source of the data, if missing the default if function arguments | false |
KProbeSelector selects function calls for kprobe based on PIDs and function arguments. The results of MatchPIDs and MatchArgs are ANDed.
| Name | Type | Description | Required |
|---|---|---|---|
| label | string | Human-readable selector label used in status and metrics. | false |
| macros | []string | A list of macros names, defined in spec.selectorsMacros.
Filters specified in macros will be appended to corresponding filters of the selector. | false |
| matchActions | []object | A list of actions to execute when this selector matches | false |
| matchArgs | []object | A list of argument filters. MatchArgs are ANDed. | false |
| matchBinaries | []object | A list of binary exec name filters. | false |
| matchCapabilities | []object | A list of capabilities and IDs | false |
| matchCapabilityChanges | []object | IDs for capabilities changes | false |
| matchData | []object | A list of argument filters. MatchData are ANDed. | false |
| matchNamespaceChanges | []object | IDs for namespace changes | false |
| matchNamespaces | []object | A list of namespaces and IDs | false |
| matchPIDs | []object | A list of process ID filters. MatchPIDs are ANDed. | false |
| matchParentBinaries | []object | A list of process parent exec name filters. | false |
| matchReturnActions | []object | A list of actions to execute when MatchReturnArgs selector matches | false |
| matchReturnArgs | []object | A list of argument filters. MatchReturnArgs are ANDed. | false |
| matchWorkloads | object | Workloads to match | false |
| Name | Type | Description | Required |
|---|---|---|---|
| action | enum | Action to execute.
The Override action has three variants, depending on what arguments are set
1. Override the return value of function
Supported hooks: kprobes, uprobes, lsm
Arguments: ArgError (return value)
2. Override the value of a register
Supported hooks: uprobes
Arguments: ArgRegs
3. Override a function call
Supported hooks: uprobes
Arguments: One of:
- ArgNewSymbol: override call to a new symbol (in the binary)
- ArgNewAddr: override call to a new address (in the binary)
- ArgNewOffset: override call to an offset (in the binary) Enum: Post, Sigkill, Override, GetUrl, DnsLookup, NoPost, Signal, TrackSock, UntrackSock, NotifyEnforcer, CleanupEnforcerNotification, Set | true |
| argError | integer | error value for override action Format: int32 | false |
| argFqdn | string | A FQDN to lookup for the dnsLookup action | false |
| argIndex | integer | An arg index for the set action Format: int32 | false |
| argNewAddr | integer | An arg value for the override action, uprobe only.
The new symbol's address.
Beware that the symbol MUST be binary compatible with the traced uprobe symbol. Format: int64 | false |
| argNewOffset | integer | An arg value for the override action, uprobe only.
The new symbol's offset.
Beware that the symbol MUST be binary compatible with the traced uprobe symbol. Format: int64 | false |
| argNewSymbol | string | An arg value for the override action, uprobe only.
The new symbol name.
Beware that the symbol MUST be binary compatible with the traced uprobe symbol. | false |
| argRegs | []string | An arg value for the override action, uprobe only. | false |
| argSig | integer | A signal number for signal action Format: int32 | false |
| argSock | integer | An arg index for the sock for trackSock and untrackSock actions Format: int32 | false |
| argUrl | string | A URL for the getUrl action | false |
| argValue | integer | An arg value for the set action Format: int32 | false |
| imaHash | boolean | Enable collection of file hashes from integrity subsystem.
Only valid with the post action. | false |
| kernelStackTrace | boolean | Enable kernel stack trace export. Only valid with the post action. | false |
| rateLimit | string | A time period within which repeated messages will not be posted. Can be
specified in seconds (default or with 's' suffix), minutes ('m' suffix)
or hours ('h' suffix). Only valid with the post action. | false |
| rateLimitScope | string | The scope of the provided rate limit argument. Can be "thread" (default),
"process" (all threads for the same process), or "global". If "thread" is
selected then rate limiting applies per thread; if "process" is selected
then rate limiting applies per process; if "global" is selected then rate
limiting applies regardless of which process or thread caused the action.
Only valid with the post action and with a rateLimit specified. | false |
| userStackTrace | boolean | Enable user stack trace export. Only valid with the post action. | false |
| Name | Type | Description | Required |
|---|---|---|---|
| operator | enum | Filter operation. Enum: Equal, NotEqual, Prefix, NotPrefix, Postfix, NotPostfix, GreaterThan, LessThan, GT, LT, Mask, SPort, NotSPort, SPortPriv, NotSportPriv, DPort, NotDPort, DPortPriv, NotDPortPriv, SAddr, NotSAddr, DAddr, NotDAddr, Protocol, Family, State, InMap, NotInMap, CapabilitiesGained, InRange, NotInRange, SubString, SubStringIgnCase, CelExpr, FileType, NotFileType | true |
| args | []integer | Position of the operator arguments (in spec file) to apply the filter to. | false |
| index | integer | Position of the argument (in function prototype) to apply the filter to. Format: int32 Minimum: 0 | false |
| values | []string | Value to compare the argument against. | false |
| Name | Type | Description | Required |
|---|---|---|---|
| operator | enum | Filter operation. Enum: In, NotIn, Prefix, NotPrefix, Postfix, NotPostfix | true |
| values | []string | Value to compare the argument against. | true |
| followChildren | boolean | In addition to binaries, match children processes of specified binaries. Default: false | false |
| Name | Type | Description | Required |
|---|---|---|---|
| operator | enum | Namespace selector operator. Enum: In, NotIn | true |
| values | []string | Capabilities to match. | true |
| isNamespaceCapability | boolean | Indicates whether these caps are namespace caps. Default: false | false |
| type | enum | Type of capabilities Enum: Effective, Inheritable, Permitted Default: Effective | false |
| Name | Type | Description | Required |
|---|---|---|---|
| operator | enum | Filter operation. Enum: Equal, NotEqual, Prefix, NotPrefix, Postfix, NotPostfix, GreaterThan, LessThan, GT, LT, Mask, SPort, NotSPort, SPortPriv, NotSportPriv, DPort, NotDPort, DPortPriv, NotDPortPriv, SAddr, NotSAddr, DAddr, NotDAddr, Protocol, Family, State, InMap, NotInMap, CapabilitiesGained, InRange, NotInRange, SubString, SubStringIgnCase, CelExpr, FileType, NotFileType | true |
| args | []integer | Position of the operator arguments (in spec file) to apply the filter to. | false |
| index | integer | Position of the argument (in function prototype) to apply the filter to. Format: int32 Minimum: 0 | false |
| values | []string | Value to compare the argument against. | false |
| Name | Type | Description | Required |
|---|---|---|---|
| operator | enum | Namespace selector operator. Enum: In, NotIn | true |
| values | []string | Namespace types (e.g., Mnt, Pid) to match. | true |
| Name | Type | Description | Required |
|---|---|---|---|
| namespace | enum | Namespace selector name. Enum: Uts, Ipc, Mnt, Pid, PidForChildren, Net, Time, TimeForChildren, Cgroup, User | true |
| operator | enum | Namespace selector operator. Enum: In, NotIn | true |
| values | []string | Namespace IDs (or host_ns for host namespace) of namespaces to match. | true |
| Name | Type | Description | Required |
|---|---|---|---|
| operator | enum | PID selector operator. Enum: In, NotIn | true |
| values | []integer | Process IDs to match. | true |
| followForks | boolean | Matches any descendant processes of the matching PIDs. Default: false | false |
| isNamespacePID | boolean | Indicates whether PIDs are namespace PIDs. Default: false | false |
| Name | Type | Description | Required |
|---|---|---|---|
| operator | enum | Filter operation. Enum: In, NotIn, Prefix, NotPrefix, Postfix, NotPostfix | true |
| values | []string | Value to compare the argument against. | true |
| followChildren | boolean | In addition to binaries, match children processes of specified binaries. Default: false | false |
| Name | Type | Description | Required |
|---|---|---|---|
| action | enum | Action to execute.
The Override action has three variants, depending on what arguments are set
1. Override the return value of function
Supported hooks: kprobes, uprobes, lsm
Arguments: ArgError (return value)
2. Override the value of a register
Supported hooks: uprobes
Arguments: ArgRegs
3. Override a function call
Supported hooks: uprobes
Arguments: One of:
- ArgNewSymbol: override call to a new symbol (in the binary)
- ArgNewAddr: override call to a new address (in the binary)
- ArgNewOffset: override call to an offset (in the binary) Enum: Post, Sigkill, Override, GetUrl, DnsLookup, NoPost, Signal, TrackSock, UntrackSock, NotifyEnforcer, CleanupEnforcerNotification, Set | true |
| argError | integer | error value for override action Format: int32 | false |
| argFqdn | string | A FQDN to lookup for the dnsLookup action | false |
| argIndex | integer | An arg index for the set action Format: int32 | false |
| argNewAddr | integer | An arg value for the override action, uprobe only.
The new symbol's address.
Beware that the symbol MUST be binary compatible with the traced uprobe symbol. Format: int64 | false |
| argNewOffset | integer | An arg value for the override action, uprobe only.
The new symbol's offset.
Beware that the symbol MUST be binary compatible with the traced uprobe symbol. Format: int64 | false |
| argNewSymbol | string | An arg value for the override action, uprobe only.
The new symbol name.
Beware that the symbol MUST be binary compatible with the traced uprobe symbol. | false |
| argRegs | []string | An arg value for the override action, uprobe only. | false |
| argSig | integer | A signal number for signal action Format: int32 | false |
| argSock | integer | An arg index for the sock for trackSock and untrackSock actions Format: int32 | false |
| argUrl | string | A URL for the getUrl action | false |
| argValue | integer | An arg value for the set action Format: int32 | false |
| imaHash | boolean | Enable collection of file hashes from integrity subsystem.
Only valid with the post action. | false |
| kernelStackTrace | boolean | Enable kernel stack trace export. Only valid with the post action. | false |
| rateLimit | string | A time period within which repeated messages will not be posted. Can be
specified in seconds (default or with 's' suffix), minutes ('m' suffix)
or hours ('h' suffix). Only valid with the post action. | false |
| rateLimitScope | string | The scope of the provided rate limit argument. Can be "thread" (default),
"process" (all threads for the same process), or "global". If "thread" is
selected then rate limiting applies per thread; if "process" is selected
then rate limiting applies per process; if "global" is selected then rate
limiting applies regardless of which process or thread caused the action.
Only valid with the post action and with a rateLimit specified. | false |
| userStackTrace | boolean | Enable user stack trace export. Only valid with the post action. | false |
| Name | Type | Description | Required |
|---|---|---|---|
| operator | enum | Filter operation. Enum: Equal, NotEqual, Prefix, NotPrefix, Postfix, NotPostfix, GreaterThan, LessThan, GT, LT, Mask, SPort, NotSPort, SPortPriv, NotSportPriv, DPort, NotDPort, DPortPriv, NotDPortPriv, SAddr, NotSAddr, DAddr, NotDAddr, Protocol, Family, State, InMap, NotInMap, CapabilitiesGained, InRange, NotInRange, SubString, SubStringIgnCase, CelExpr, FileType, NotFileType | true |
| args | []integer | Position of the operator arguments (in spec file) to apply the filter to. | false |
| index | integer | Position of the argument (in function prototype) to apply the filter to. Format: int32 Minimum: 0 | false |
| values | []string | Value to compare the argument against. | false |
Workloads to match
| Name | Type | Description | Required |
|---|---|---|---|
| containerSelector | object | ContainerSelector selects containers that this policy applies to.
A map of container fields will be constructed in the same way as a map of labels.
The name of the field represents the label "key", and the value of the field - label "value".
Currently, only the "name" field is supported. | false |
| hostSelector | object | HostSelector selects hosts that this policy applies to.
For now only ~ (none) and {} (all) is supported. Validations: | false |
| podSelector | object | PodSelector selects pods that this policy applies to | false |
ContainerSelector selects containers that this policy applies to. A map of container fields will be constructed in the same way as a map of labels. The name of the field represents the label “key”, and the value of the field - label “value”. Currently, only the “name” field is supported.
| Name | Type | Description | Required |
|---|---|---|---|
| matchExpressions | []object | matchExpressions is a list of label selector requirements. The requirements are ANDed. | false |
| matchLabels | map[string]string | matchLabels is a map of {key,value} pairs. A single {key,value} in the matchLabels
map is equivalent to an element of matchExpressions, whose key field is "key", the
operator is "In", and the values array contains only "value". The requirements are ANDed. | false |
A label selector requirement is a selector that contains values, a key, and an operator that relates the key and values.
| Name | Type | Description | Required |
|---|---|---|---|
| key | string | key is the label key that the selector applies to. | true |
| operator | enum | operator represents a key's relationship to a set of values.
Valid operators are In, NotIn, Exists and DoesNotExist. Enum: In, NotIn, Exists, DoesNotExist | true |
| values | []string | values is an array of string values. If the operator is In or NotIn,
the values array must be non-empty. If the operator is Exists or DoesNotExist,
the values array must be empty. This array is replaced during a strategic
merge patch. | false |
HostSelector selects hosts that this policy applies to. For now only ~ (none) and {} (all) is supported.
| Name | Type | Description | Required |
|---|---|---|---|
| matchExpressions | []object | matchExpressions is a list of label selector requirements. The requirements are ANDed. | false |
| matchLabels | map[string]string | matchLabels is a map of {key,value} pairs. A single {key,value} in the matchLabels
map is equivalent to an element of matchExpressions, whose key field is "key", the
operator is "In", and the values array contains only "value". The requirements are ANDed. | false |
A label selector requirement is a selector that contains values, a key, and an operator that relates the key and values.
| Name | Type | Description | Required |
|---|---|---|---|
| key | string | key is the label key that the selector applies to. | true |
| operator | enum | operator represents a key's relationship to a set of values.
Valid operators are In, NotIn, Exists and DoesNotExist. Enum: In, NotIn, Exists, DoesNotExist | true |
| values | []string | values is an array of string values. If the operator is In or NotIn,
the values array must be non-empty. If the operator is Exists or DoesNotExist,
the values array must be empty. This array is replaced during a strategic
merge patch. | false |
PodSelector selects pods that this policy applies to
| Name | Type | Description | Required |
|---|---|---|---|
| matchExpressions | []object | matchExpressions is a list of label selector requirements. The requirements are ANDed. | false |
| matchLabels | map[string]string | matchLabels is a map of {key,value} pairs. A single {key,value} in the matchLabels
map is equivalent to an element of matchExpressions, whose key field is "key", the
operator is "In", and the values array contains only "value". The requirements are ANDed. | false |
A label selector requirement is a selector that contains values, a key, and an operator that relates the key and values.
| Name | Type | Description | Required |
|---|---|---|---|
| key | string | key is the label key that the selector applies to. | true |
| operator | enum | operator represents a key's relationship to a set of values.
Valid operators are In, NotIn, Exists and DoesNotExist. Enum: In, NotIn, Exists, DoesNotExist | true |
| values | []string | values is an array of string values. If the operator is In or NotIn,
the values array must be non-empty. If the operator is Exists or DoesNotExist,
the values array must be empty. This array is replaced during a strategic
merge patch. | false |
HostSelector selects hosts that this policy applies to. For now only ~ (none) and {} (all) is supported.
| Name | Type | Description | Required |
|---|---|---|---|
| matchExpressions | []object | matchExpressions is a list of label selector requirements. The requirements are ANDed. | false |
| matchLabels | map[string]string | matchLabels is a map of {key,value} pairs. A single {key,value} in the matchLabels
map is equivalent to an element of matchExpressions, whose key field is "key", the
operator is "In", and the values array contains only "value". The requirements are ANDed. | false |
A label selector requirement is a selector that contains values, a key, and an operator that relates the key and values.
| Name | Type | Description | Required |
|---|---|---|---|
| key | string | key is the label key that the selector applies to. | true |
| operator | enum | operator represents a key's relationship to a set of values.
Valid operators are In, NotIn, Exists and DoesNotExist. Enum: In, NotIn, Exists, DoesNotExist | true |
| values | []string | values is an array of string values. If the operator is In or NotIn,
the values array must be non-empty. If the operator is Exists or DoesNotExist,
the values array must be empty. This array is replaced during a strategic
merge patch. | false |
| Name | Type | Description | Required |
|---|---|---|---|
| call | string | Name of the function to apply the kprobe spec to. | true |
| args | []object | A list of function arguments to include in the trace output. | false |
| data | []object | A list of data to include in the trace output. | false |
| ignore | object | Conditions for ignoring this kprobe | false |
| message | string | A short message of 256 characters max that will be included
in the event output to inform users what is going on. | false |
| return | boolean | Indicates whether to collect return value of the traced function. Default: false | false |
| returnArg | object | A return argument to include in the trace output. | false |
| returnArgAction | string | An action to perform on the return value.
Use returnArg to include the return value in the event output.
Supported actions are: TrackSock;UntrackSock | false |
| selectors | []object | Selectors to apply before producing trace output. Selectors are ORed and short-circuited. | false |
| syscall | boolean | Indicates whether the traced function is a syscall. Default: true | false |
| tags | []string | Tags to categorize the event, will be include in the event output.
Maximum of 16 Tags are supported. | false |
| Name | Type | Description | Required |
|---|---|---|---|
| index | integer | Position of the argument. Format: int32 Minimum: 0 | true |
| type | enum | Argument type. Enum: auto, int, sint8, int8, uint8, sint16, int16, uint16, uint32, sint32, int32, ulong, uint64, size_t, long, sint64, int64, char_buf, char_iovec, skb, sock, sockaddr, socket, sockaddr_un, string, fd, file, filename, path, nop, bpf_attr, perf_event, bpf_map, user_namespace, capability, kiocb, iov_iter, cred, const_buf, load_info, module, syscall64, kernel_cap_t, cap_inheritable, cap_permitted, cap_effective, linux_binprm, data_loc, net_device, bpf_cmd, dentry, bpf_prog Default: auto | true |
| btfType | string | Type to use as the initial resolve type. For kprobe args it looks up the named struct
from the kernel BTF, casting the argument's type before traversing the resolve path.
For UprobeSpecs and UsdtSpecs it looks up the type from the BTF file defined by BTFPath. | false |
| btfTypeModule | string | Kernel module that contains the BTFType. This is used only for kprobe args.
The module must already be loaded and expose BTF in /sys/kernel/btf. | false |
| label | string | Label to output in the JSON | false |
| maxData | boolean | Read maximum possible data (currently 327360). This field is only used
for char_buff data. When this value is false (default), the bpf program
will fetch at most 4096 bytes. In later kernels (>=5.4) tetragon
supports fetching up to 327360 bytes if this flag is turned on Default: false | false |
| resolve | string | Resolve the path to a specific attribute Default: | false |
| returnCopy | boolean | This field is used only for char_buf and char_iovec types. It indicates
that this argument should be read later (when the kretprobe for the
symbol is triggered) because it might not be populated when the kprobe
is triggered at the entrance of the function. For example, a buffer
supplied to read(2) won't have content until kretprobe is triggered. Default: false | false |
| sizeArgIndex | integer | Specifies the position of the corresponding size argument for this argument.
This field is used only for char_buf and char_iovec types. Format: int32 Minimum: 0 | false |
| source | string | Source of the data, if missing the default if function arguments | false |
| Name | Type | Description | Required |
|---|---|---|---|
| index | integer | Position of the argument. Format: int32 Minimum: 0 | true |
| type | enum | Argument type. Enum: auto, int, sint8, int8, uint8, sint16, int16, uint16, uint32, sint32, int32, ulong, uint64, size_t, long, sint64, int64, char_buf, char_iovec, skb, sock, sockaddr, socket, sockaddr_un, string, fd, file, filename, path, nop, bpf_attr, perf_event, bpf_map, user_namespace, capability, kiocb, iov_iter, cred, const_buf, load_info, module, syscall64, kernel_cap_t, cap_inheritable, cap_permitted, cap_effective, linux_binprm, data_loc, net_device, bpf_cmd, dentry, bpf_prog Default: auto | true |
| btfType | string | Type to use as the initial resolve type. For kprobe args it looks up the named struct
from the kernel BTF, casting the argument's type before traversing the resolve path.
For UprobeSpecs and UsdtSpecs it looks up the type from the BTF file defined by BTFPath. | false |
| btfTypeModule | string | Kernel module that contains the BTFType. This is used only for kprobe args.
The module must already be loaded and expose BTF in /sys/kernel/btf. | false |
| label | string | Label to output in the JSON | false |
| maxData | boolean | Read maximum possible data (currently 327360). This field is only used
for char_buff data. When this value is false (default), the bpf program
will fetch at most 4096 bytes. In later kernels (>=5.4) tetragon
supports fetching up to 327360 bytes if this flag is turned on Default: false | false |
| resolve | string | Resolve the path to a specific attribute Default: | false |
| returnCopy | boolean | This field is used only for char_buf and char_iovec types. It indicates
that this argument should be read later (when the kretprobe for the
symbol is triggered) because it might not be populated when the kprobe
is triggered at the entrance of the function. For example, a buffer
supplied to read(2) won't have content until kretprobe is triggered. Default: false | false |
| sizeArgIndex | integer | Specifies the position of the corresponding size argument for this argument.
This field is used only for char_buf and char_iovec types. Format: int32 Minimum: 0 | false |
| source | string | Source of the data, if missing the default if function arguments | false |
Conditions for ignoring this kprobe
| Name | Type | Description | Required |
|---|---|---|---|
| callNotFound | boolean | Ignores calls that are not present in the system | false |
A return argument to include in the trace output.
| Name | Type | Description | Required |
|---|---|---|---|
| index | integer | Position of the argument. Format: int32 Minimum: 0 | true |
| type | enum | Argument type. Enum: auto, int, sint8, int8, uint8, sint16, int16, uint16, uint32, sint32, int32, ulong, uint64, size_t, long, sint64, int64, char_buf, char_iovec, skb, sock, sockaddr, socket, sockaddr_un, string, fd, file, filename, path, nop, bpf_attr, perf_event, bpf_map, user_namespace, capability, kiocb, iov_iter, cred, const_buf, load_info, module, syscall64, kernel_cap_t, cap_inheritable, cap_permitted, cap_effective, linux_binprm, data_loc, net_device, bpf_cmd, dentry, bpf_prog Default: auto | true |
| btfType | string | Type to use as the initial resolve type. For kprobe args it looks up the named struct
from the kernel BTF, casting the argument's type before traversing the resolve path.
For UprobeSpecs and UsdtSpecs it looks up the type from the BTF file defined by BTFPath. | false |
| btfTypeModule | string | Kernel module that contains the BTFType. This is used only for kprobe args.
The module must already be loaded and expose BTF in /sys/kernel/btf. | false |
| label | string | Label to output in the JSON | false |
| maxData | boolean | Read maximum possible data (currently 327360). This field is only used
for char_buff data. When this value is false (default), the bpf program
will fetch at most 4096 bytes. In later kernels (>=5.4) tetragon
supports fetching up to 327360 bytes if this flag is turned on Default: false | false |
| resolve | string | Resolve the path to a specific attribute Default: | false |
| returnCopy | boolean | This field is used only for char_buf and char_iovec types. It indicates
that this argument should be read later (when the kretprobe for the
symbol is triggered) because it might not be populated when the kprobe
is triggered at the entrance of the function. For example, a buffer
supplied to read(2) won't have content until kretprobe is triggered. Default: false | false |
| sizeArgIndex | integer | Specifies the position of the corresponding size argument for this argument.
This field is used only for char_buf and char_iovec types. Format: int32 Minimum: 0 | false |
| source | string | Source of the data, if missing the default if function arguments | false |
KProbeSelector selects function calls for kprobe based on PIDs and function arguments. The results of MatchPIDs and MatchArgs are ANDed.
| Name | Type | Description | Required |
|---|---|---|---|
| label | string | Human-readable selector label used in status and metrics. | false |
| macros | []string | A list of macros names, defined in spec.selectorsMacros.
Filters specified in macros will be appended to corresponding filters of the selector. | false |
| matchActions | []object | A list of actions to execute when this selector matches | false |
| matchArgs | []object | A list of argument filters. MatchArgs are ANDed. | false |
| matchBinaries | []object | A list of binary exec name filters. | false |
| matchCapabilities | []object | A list of capabilities and IDs | false |
| matchCapabilityChanges | []object | IDs for capabilities changes | false |
| matchData | []object | A list of argument filters. MatchData are ANDed. | false |
| matchNamespaceChanges | []object | IDs for namespace changes | false |
| matchNamespaces | []object | A list of namespaces and IDs | false |
| matchPIDs | []object | A list of process ID filters. MatchPIDs are ANDed. | false |
| matchParentBinaries | []object | A list of process parent exec name filters. | false |
| matchReturnActions | []object | A list of actions to execute when MatchReturnArgs selector matches | false |
| matchReturnArgs | []object | A list of argument filters. MatchReturnArgs are ANDed. | false |
| matchWorkloads | object | Workloads to match | false |
| Name | Type | Description | Required |
|---|---|---|---|
| action | enum | Action to execute.
The Override action has three variants, depending on what arguments are set
1. Override the return value of function
Supported hooks: kprobes, uprobes, lsm
Arguments: ArgError (return value)
2. Override the value of a register
Supported hooks: uprobes
Arguments: ArgRegs
3. Override a function call
Supported hooks: uprobes
Arguments: One of:
- ArgNewSymbol: override call to a new symbol (in the binary)
- ArgNewAddr: override call to a new address (in the binary)
- ArgNewOffset: override call to an offset (in the binary) Enum: Post, Sigkill, Override, GetUrl, DnsLookup, NoPost, Signal, TrackSock, UntrackSock, NotifyEnforcer, CleanupEnforcerNotification, Set | true |
| argError | integer | error value for override action Format: int32 | false |
| argFqdn | string | A FQDN to lookup for the dnsLookup action | false |
| argIndex | integer | An arg index for the set action Format: int32 | false |
| argNewAddr | integer | An arg value for the override action, uprobe only.
The new symbol's address.
Beware that the symbol MUST be binary compatible with the traced uprobe symbol. Format: int64 | false |
| argNewOffset | integer | An arg value for the override action, uprobe only.
The new symbol's offset.
Beware that the symbol MUST be binary compatible with the traced uprobe symbol. Format: int64 | false |
| argNewSymbol | string | An arg value for the override action, uprobe only.
The new symbol name.
Beware that the symbol MUST be binary compatible with the traced uprobe symbol. | false |
| argRegs | []string | An arg value for the override action, uprobe only. | false |
| argSig | integer | A signal number for signal action Format: int32 | false |
| argSock | integer | An arg index for the sock for trackSock and untrackSock actions Format: int32 | false |
| argUrl | string | A URL for the getUrl action | false |
| argValue | integer | An arg value for the set action Format: int32 | false |
| imaHash | boolean | Enable collection of file hashes from integrity subsystem.
Only valid with the post action. | false |
| kernelStackTrace | boolean | Enable kernel stack trace export. Only valid with the post action. | false |
| rateLimit | string | A time period within which repeated messages will not be posted. Can be
specified in seconds (default or with 's' suffix), minutes ('m' suffix)
or hours ('h' suffix). Only valid with the post action. | false |
| rateLimitScope | string | The scope of the provided rate limit argument. Can be "thread" (default),
"process" (all threads for the same process), or "global". If "thread" is
selected then rate limiting applies per thread; if "process" is selected
then rate limiting applies per process; if "global" is selected then rate
limiting applies regardless of which process or thread caused the action.
Only valid with the post action and with a rateLimit specified. | false |
| userStackTrace | boolean | Enable user stack trace export. Only valid with the post action. | false |
| Name | Type | Description | Required |
|---|---|---|---|
| operator | enum | Filter operation. Enum: Equal, NotEqual, Prefix, NotPrefix, Postfix, NotPostfix, GreaterThan, LessThan, GT, LT, Mask, SPort, NotSPort, SPortPriv, NotSportPriv, DPort, NotDPort, DPortPriv, NotDPortPriv, SAddr, NotSAddr, DAddr, NotDAddr, Protocol, Family, State, InMap, NotInMap, CapabilitiesGained, InRange, NotInRange, SubString, SubStringIgnCase, CelExpr, FileType, NotFileType | true |
| args | []integer | Position of the operator arguments (in spec file) to apply the filter to. | false |
| index | integer | Position of the argument (in function prototype) to apply the filter to. Format: int32 Minimum: 0 | false |
| values | []string | Value to compare the argument against. | false |
| Name | Type | Description | Required |
|---|---|---|---|
| operator | enum | Filter operation. Enum: In, NotIn, Prefix, NotPrefix, Postfix, NotPostfix | true |
| values | []string | Value to compare the argument against. | true |
| followChildren | boolean | In addition to binaries, match children processes of specified binaries. Default: false | false |
| Name | Type | Description | Required |
|---|---|---|---|
| operator | enum | Namespace selector operator. Enum: In, NotIn | true |
| values | []string | Capabilities to match. | true |
| isNamespaceCapability | boolean | Indicates whether these caps are namespace caps. Default: false | false |
| type | enum | Type of capabilities Enum: Effective, Inheritable, Permitted Default: Effective | false |
| Name | Type | Description | Required |
|---|---|---|---|
| operator | enum | Namespace selector operator. Enum: In, NotIn | true |
| values | []string | Capabilities to match. | true |
| isNamespaceCapability | boolean | Indicates whether these caps are namespace caps. Default: false | false |
| type | enum | Type of capabilities Enum: Effective, Inheritable, Permitted Default: Effective | false |
| Name | Type | Description | Required |
|---|---|---|---|
| operator | enum | Filter operation. Enum: Equal, NotEqual, Prefix, NotPrefix, Postfix, NotPostfix, GreaterThan, LessThan, GT, LT, Mask, SPort, NotSPort, SPortPriv, NotSportPriv, DPort, NotDPort, DPortPriv, NotDPortPriv, SAddr, NotSAddr, DAddr, NotDAddr, Protocol, Family, State, InMap, NotInMap, CapabilitiesGained, InRange, NotInRange, SubString, SubStringIgnCase, CelExpr, FileType, NotFileType | true |
| args | []integer | Position of the operator arguments (in spec file) to apply the filter to. | false |
| index | integer | Position of the argument (in function prototype) to apply the filter to. Format: int32 Minimum: 0 | false |
| values | []string | Value to compare the argument against. | false |
| Name | Type | Description | Required |
|---|---|---|---|
| operator | enum | Namespace selector operator. Enum: In, NotIn | true |
| values | []string | Namespace types (e.g., Mnt, Pid) to match. | true |
| Name | Type | Description | Required |
|---|---|---|---|
| namespace | enum | Namespace selector name. Enum: Uts, Ipc, Mnt, Pid, PidForChildren, Net, Time, TimeForChildren, Cgroup, User | true |
| operator | enum | Namespace selector operator. Enum: In, NotIn | true |
| values | []string | Namespace IDs (or host_ns for host namespace) of namespaces to match. | true |
| Name | Type | Description | Required |
|---|---|---|---|
| operator | enum | PID selector operator. Enum: In, NotIn | true |
| values | []integer | Process IDs to match. | true |
| followForks | boolean | Matches any descendant processes of the matching PIDs. Default: false | false |
| isNamespacePID | boolean | Indicates whether PIDs are namespace PIDs. Default: false | false |
| Name | Type | Description | Required |
|---|---|---|---|
| operator | enum | Filter operation. Enum: In, NotIn, Prefix, NotPrefix, Postfix, NotPostfix | true |
| values | []string | Value to compare the argument against. | true |
| followChildren | boolean | In addition to binaries, match children processes of specified binaries. Default: false | false |
| Name | Type | Description | Required |
|---|---|---|---|
| action | enum | Action to execute.
The Override action has three variants, depending on what arguments are set
1. Override the return value of function
Supported hooks: kprobes, uprobes, lsm
Arguments: ArgError (return value)
2. Override the value of a register
Supported hooks: uprobes
Arguments: ArgRegs
3. Override a function call
Supported hooks: uprobes
Arguments: One of:
- ArgNewSymbol: override call to a new symbol (in the binary)
- ArgNewAddr: override call to a new address (in the binary)
- ArgNewOffset: override call to an offset (in the binary) Enum: Post, Sigkill, Override, GetUrl, DnsLookup, NoPost, Signal, TrackSock, UntrackSock, NotifyEnforcer, CleanupEnforcerNotification, Set | true |
| argError | integer | error value for override action Format: int32 | false |
| argFqdn | string | A FQDN to lookup for the dnsLookup action | false |
| argIndex | integer | An arg index for the set action Format: int32 | false |
| argNewAddr | integer | An arg value for the override action, uprobe only.
The new symbol's address.
Beware that the symbol MUST be binary compatible with the traced uprobe symbol. Format: int64 | false |
| argNewOffset | integer | An arg value for the override action, uprobe only.
The new symbol's offset.
Beware that the symbol MUST be binary compatible with the traced uprobe symbol. Format: int64 | false |
| argNewSymbol | string | An arg value for the override action, uprobe only.
The new symbol name.
Beware that the symbol MUST be binary compatible with the traced uprobe symbol. | false |
| argRegs | []string | An arg value for the override action, uprobe only. | false |
| argSig | integer | A signal number for signal action Format: int32 | false |
| argSock | integer | An arg index for the sock for trackSock and untrackSock actions Format: int32 | false |
| argUrl | string | A URL for the getUrl action | false |
| argValue | integer | An arg value for the set action Format: int32 | false |
| imaHash | boolean | Enable collection of file hashes from integrity subsystem.
Only valid with the post action. | false |
| kernelStackTrace | boolean | Enable kernel stack trace export. Only valid with the post action. | false |
| rateLimit | string | A time period within which repeated messages will not be posted. Can be
specified in seconds (default or with 's' suffix), minutes ('m' suffix)
or hours ('h' suffix). Only valid with the post action. | false |
| rateLimitScope | string | The scope of the provided rate limit argument. Can be "thread" (default),
"process" (all threads for the same process), or "global". If "thread" is
selected then rate limiting applies per thread; if "process" is selected
then rate limiting applies per process; if "global" is selected then rate
limiting applies regardless of which process or thread caused the action.
Only valid with the post action and with a rateLimit specified. | false |
| userStackTrace | boolean | Enable user stack trace export. Only valid with the post action. | false |
| Name | Type | Description | Required |
|---|---|---|---|
| operator | enum | Filter operation. Enum: Equal, NotEqual, Prefix, NotPrefix, Postfix, NotPostfix, GreaterThan, LessThan, GT, LT, Mask, SPort, NotSPort, SPortPriv, NotSportPriv, DPort, NotDPort, DPortPriv, NotDPortPriv, SAddr, NotSAddr, DAddr, NotDAddr, Protocol, Family, State, InMap, NotInMap, CapabilitiesGained, InRange, NotInRange, SubString, SubStringIgnCase, CelExpr, FileType, NotFileType | true |
| args | []integer | Position of the operator arguments (in spec file) to apply the filter to. | false |
| index | integer | Position of the argument (in function prototype) to apply the filter to. Format: int32 Minimum: 0 | false |
| values | []string | Value to compare the argument against. | false |
Workloads to match
| Name | Type | Description | Required |
|---|---|---|---|
| containerSelector | object | ContainerSelector selects containers that this policy applies to.
A map of container fields will be constructed in the same way as a map of labels.
The name of the field represents the label "key", and the value of the field - label "value".
Currently, only the "name" field is supported. | false |
| hostSelector | object | HostSelector selects hosts that this policy applies to.
For now only ~ (none) and {} (all) is supported. Validations: | false |
| podSelector | object | PodSelector selects pods that this policy applies to | false |
ContainerSelector selects containers that this policy applies to. A map of container fields will be constructed in the same way as a map of labels. The name of the field represents the label “key”, and the value of the field - label “value”. Currently, only the “name” field is supported.
| Name | Type | Description | Required |
|---|---|---|---|
| matchExpressions | []object | matchExpressions is a list of label selector requirements. The requirements are ANDed. | false |
| matchLabels | map[string]string | matchLabels is a map of {key,value} pairs. A single {key,value} in the matchLabels
map is equivalent to an element of matchExpressions, whose key field is "key", the
operator is "In", and the values array contains only "value". The requirements are ANDed. | false |
A label selector requirement is a selector that contains values, a key, and an operator that relates the key and values.
| Name | Type | Description | Required |
|---|---|---|---|
| key | string | key is the label key that the selector applies to. | true |
| operator | enum | operator represents a key's relationship to a set of values.
Valid operators are In, NotIn, Exists and DoesNotExist. Enum: In, NotIn, Exists, DoesNotExist | true |
| values | []string | values is an array of string values. If the operator is In or NotIn,
the values array must be non-empty. If the operator is Exists or DoesNotExist,
the values array must be empty. This array is replaced during a strategic
merge patch. | false |
HostSelector selects hosts that this policy applies to. For now only ~ (none) and {} (all) is supported.
| Name | Type | Description | Required |
|---|---|---|---|
| matchExpressions | []object | matchExpressions is a list of label selector requirements. The requirements are ANDed. | false |
| matchLabels | map[string]string | matchLabels is a map of {key,value} pairs. A single {key,value} in the matchLabels
map is equivalent to an element of matchExpressions, whose key field is "key", the
operator is "In", and the values array contains only "value". The requirements are ANDed. | false |
A label selector requirement is a selector that contains values, a key, and an operator that relates the key and values.
| Name | Type | Description | Required |
|---|---|---|---|
| key | string | key is the label key that the selector applies to. | true |
| operator | enum | operator represents a key's relationship to a set of values.
Valid operators are In, NotIn, Exists and DoesNotExist. Enum: In, NotIn, Exists, DoesNotExist | true |
| values | []string | values is an array of string values. If the operator is In or NotIn,
the values array must be non-empty. If the operator is Exists or DoesNotExist,
the values array must be empty. This array is replaced during a strategic
merge patch. | false |
PodSelector selects pods that this policy applies to
| Name | Type | Description | Required |
|---|---|---|---|
| matchExpressions | []object | matchExpressions is a list of label selector requirements. The requirements are ANDed. | false |
| matchLabels | map[string]string | matchLabels is a map of {key,value} pairs. A single {key,value} in the matchLabels
map is equivalent to an element of matchExpressions, whose key field is "key", the
operator is "In", and the values array contains only "value". The requirements are ANDed. | false |
A label selector requirement is a selector that contains values, a key, and an operator that relates the key and values.
| Name | Type | Description | Required |
|---|---|---|---|
| key | string | key is the label key that the selector applies to. | true |
| operator | enum | operator represents a key's relationship to a set of values.
Valid operators are In, NotIn, Exists and DoesNotExist. Enum: In, NotIn, Exists, DoesNotExist | true |
| values | []string | values is an array of string values. If the operator is In or NotIn,
the values array must be non-empty. If the operator is Exists or DoesNotExist,
the values array must be empty. This array is replaced during a strategic
merge patch. | false |
| Name | Type | Description | Required |
|---|---|---|---|
| name | string | Name of the list | true |
| pattern | string | Pattern for 'generated' lists. | false |
| type | enum | Indicates the type of the list values. Enum: syscalls, generated_syscalls, generated_ftrace | false |
| validated | boolean | List was validated | false |
| values | []string | Values of the list | false |
| Name | Type | Description | Required |
|---|---|---|---|
| hook | string | Name of the function to apply the kprobe spec to. | true |
| args | []object | A list of function arguments to include in the trace output. | false |
| message | string | A short message of 256 characters max that will be included
in the event output to inform users what is going on. | false |
| selectors | []object | Selectors to apply before producing trace output. Selectors are ORed. | false |
| tags | []string | Tags to categorize the event, will be include in the event output.
Maximum of 16 Tags are supported. | false |
| Name | Type | Description | Required |
|---|---|---|---|
| index | integer | Position of the argument. Format: int32 Minimum: 0 | true |
| type | enum | Argument type. Enum: auto, int, sint8, int8, uint8, sint16, int16, uint16, uint32, sint32, int32, ulong, uint64, size_t, long, sint64, int64, char_buf, char_iovec, skb, sock, sockaddr, socket, sockaddr_un, string, fd, file, filename, path, nop, bpf_attr, perf_event, bpf_map, user_namespace, capability, kiocb, iov_iter, cred, const_buf, load_info, module, syscall64, kernel_cap_t, cap_inheritable, cap_permitted, cap_effective, linux_binprm, data_loc, net_device, bpf_cmd, dentry, bpf_prog Default: auto | true |
| btfType | string | Type to use as the initial resolve type. For kprobe args it looks up the named struct
from the kernel BTF, casting the argument's type before traversing the resolve path.
For UprobeSpecs and UsdtSpecs it looks up the type from the BTF file defined by BTFPath. | false |
| btfTypeModule | string | Kernel module that contains the BTFType. This is used only for kprobe args.
The module must already be loaded and expose BTF in /sys/kernel/btf. | false |
| label | string | Label to output in the JSON | false |
| maxData | boolean | Read maximum possible data (currently 327360). This field is only used
for char_buff data. When this value is false (default), the bpf program
will fetch at most 4096 bytes. In later kernels (>=5.4) tetragon
supports fetching up to 327360 bytes if this flag is turned on Default: false | false |
| resolve | string | Resolve the path to a specific attribute Default: | false |
| returnCopy | boolean | This field is used only for char_buf and char_iovec types. It indicates
that this argument should be read later (when the kretprobe for the
symbol is triggered) because it might not be populated when the kprobe
is triggered at the entrance of the function. For example, a buffer
supplied to read(2) won't have content until kretprobe is triggered. Default: false | false |
| sizeArgIndex | integer | Specifies the position of the corresponding size argument for this argument.
This field is used only for char_buf and char_iovec types. Format: int32 Minimum: 0 | false |
| source | string | Source of the data, if missing the default if function arguments | false |
KProbeSelector selects function calls for kprobe based on PIDs and function arguments. The results of MatchPIDs and MatchArgs are ANDed.
| Name | Type | Description | Required |
|---|---|---|---|
| label | string | Human-readable selector label used in status and metrics. | false |
| macros | []string | A list of macros names, defined in spec.selectorsMacros.
Filters specified in macros will be appended to corresponding filters of the selector. | false |
| matchActions | []object | A list of actions to execute when this selector matches | false |
| matchArgs | []object | A list of argument filters. MatchArgs are ANDed. | false |
| matchBinaries | []object | A list of binary exec name filters. | false |
| matchCapabilities | []object | A list of capabilities and IDs | false |
| matchCapabilityChanges | []object | IDs for capabilities changes | false |
| matchData | []object | A list of argument filters. MatchData are ANDed. | false |
| matchNamespaceChanges | []object | IDs for namespace changes | false |
| matchNamespaces | []object | A list of namespaces and IDs | false |
| matchPIDs | []object | A list of process ID filters. MatchPIDs are ANDed. | false |
| matchParentBinaries | []object | A list of process parent exec name filters. | false |
| matchReturnActions | []object | A list of actions to execute when MatchReturnArgs selector matches | false |
| matchReturnArgs | []object | A list of argument filters. MatchReturnArgs are ANDed. | false |
| matchWorkloads | object | Workloads to match | false |
| Name | Type | Description | Required |
|---|---|---|---|
| action | enum | Action to execute.
The Override action has three variants, depending on what arguments are set
1. Override the return value of function
Supported hooks: kprobes, uprobes, lsm
Arguments: ArgError (return value)
2. Override the value of a register
Supported hooks: uprobes
Arguments: ArgRegs
3. Override a function call
Supported hooks: uprobes
Arguments: One of:
- ArgNewSymbol: override call to a new symbol (in the binary)
- ArgNewAddr: override call to a new address (in the binary)
- ArgNewOffset: override call to an offset (in the binary) Enum: Post, Sigkill, Override, GetUrl, DnsLookup, NoPost, Signal, TrackSock, UntrackSock, NotifyEnforcer, CleanupEnforcerNotification, Set | true |
| argError | integer | error value for override action Format: int32 | false |
| argFqdn | string | A FQDN to lookup for the dnsLookup action | false |
| argIndex | integer | An arg index for the set action Format: int32 | false |
| argNewAddr | integer | An arg value for the override action, uprobe only.
The new symbol's address.
Beware that the symbol MUST be binary compatible with the traced uprobe symbol. Format: int64 | false |
| argNewOffset | integer | An arg value for the override action, uprobe only.
The new symbol's offset.
Beware that the symbol MUST be binary compatible with the traced uprobe symbol. Format: int64 | false |
| argNewSymbol | string | An arg value for the override action, uprobe only.
The new symbol name.
Beware that the symbol MUST be binary compatible with the traced uprobe symbol. | false |
| argRegs | []string | An arg value for the override action, uprobe only. | false |
| argSig | integer | A signal number for signal action Format: int32 | false |
| argSock | integer | An arg index for the sock for trackSock and untrackSock actions Format: int32 | false |
| argUrl | string | A URL for the getUrl action | false |
| argValue | integer | An arg value for the set action Format: int32 | false |
| imaHash | boolean | Enable collection of file hashes from integrity subsystem.
Only valid with the post action. | false |
| kernelStackTrace | boolean | Enable kernel stack trace export. Only valid with the post action. | false |
| rateLimit | string | A time period within which repeated messages will not be posted. Can be
specified in seconds (default or with 's' suffix), minutes ('m' suffix)
or hours ('h' suffix). Only valid with the post action. | false |
| rateLimitScope | string | The scope of the provided rate limit argument. Can be "thread" (default),
"process" (all threads for the same process), or "global". If "thread" is
selected then rate limiting applies per thread; if "process" is selected
then rate limiting applies per process; if "global" is selected then rate
limiting applies regardless of which process or thread caused the action.
Only valid with the post action and with a rateLimit specified. | false |
| userStackTrace | boolean | Enable user stack trace export. Only valid with the post action. | false |
| Name | Type | Description | Required |
|---|---|---|---|
| operator | enum | Filter operation. Enum: Equal, NotEqual, Prefix, NotPrefix, Postfix, NotPostfix, GreaterThan, LessThan, GT, LT, Mask, SPort, NotSPort, SPortPriv, NotSportPriv, DPort, NotDPort, DPortPriv, NotDPortPriv, SAddr, NotSAddr, DAddr, NotDAddr, Protocol, Family, State, InMap, NotInMap, CapabilitiesGained, InRange, NotInRange, SubString, SubStringIgnCase, CelExpr, FileType, NotFileType | true |
| args | []integer | Position of the operator arguments (in spec file) to apply the filter to. | false |
| index | integer | Position of the argument (in function prototype) to apply the filter to. Format: int32 Minimum: 0 | false |
| values | []string | Value to compare the argument against. | false |
| Name | Type | Description | Required |
|---|---|---|---|
| operator | enum | Filter operation. Enum: In, NotIn, Prefix, NotPrefix, Postfix, NotPostfix | true |
| values | []string | Value to compare the argument against. | true |
| followChildren | boolean | In addition to binaries, match children processes of specified binaries. Default: false | false |
| Name | Type | Description | Required |
|---|---|---|---|
| operator | enum | Namespace selector operator. Enum: In, NotIn | true |
| values | []string | Capabilities to match. | true |
| isNamespaceCapability | boolean | Indicates whether these caps are namespace caps. Default: false | false |
| type | enum | Type of capabilities Enum: Effective, Inheritable, Permitted Default: Effective | false |
| Name | Type | Description | Required |
|---|---|---|---|
| operator | enum | Namespace selector operator. Enum: In, NotIn | true |
| values | []string | Capabilities to match. | true |
| isNamespaceCapability | boolean | Indicates whether these caps are namespace caps. Default: false | false |
| type | enum | Type of capabilities Enum: Effective, Inheritable, Permitted Default: Effective | false |
| Name | Type | Description | Required |
|---|---|---|---|
| operator | enum | Filter operation. Enum: Equal, NotEqual, Prefix, NotPrefix, Postfix, NotPostfix, GreaterThan, LessThan, GT, LT, Mask, SPort, NotSPort, SPortPriv, NotSportPriv, DPort, NotDPort, DPortPriv, NotDPortPriv, SAddr, NotSAddr, DAddr, NotDAddr, Protocol, Family, State, InMap, NotInMap, CapabilitiesGained, InRange, NotInRange, SubString, SubStringIgnCase, CelExpr, FileType, NotFileType | true |
| args | []integer | Position of the operator arguments (in spec file) to apply the filter to. | false |
| index | integer | Position of the argument (in function prototype) to apply the filter to. Format: int32 Minimum: 0 | false |
| values | []string | Value to compare the argument against. | false |
| Name | Type | Description | Required |
|---|---|---|---|
| operator | enum | Namespace selector operator. Enum: In, NotIn | true |
| values | []string | Namespace types (e.g., Mnt, Pid) to match. | true |
| Name | Type | Description | Required |
|---|---|---|---|
| namespace | enum | Namespace selector name. Enum: Uts, Ipc, Mnt, Pid, PidForChildren, Net, Time, TimeForChildren, Cgroup, User | true |
| operator | enum | Namespace selector operator. Enum: In, NotIn | true |
| values | []string | Namespace IDs (or host_ns for host namespace) of namespaces to match. | true |
| Name | Type | Description | Required |
|---|---|---|---|
| operator | enum | PID selector operator. Enum: In, NotIn | true |
| values | []integer | Process IDs to match. | true |
| followForks | boolean | Matches any descendant processes of the matching PIDs. Default: false | false |
| isNamespacePID | boolean | Indicates whether PIDs are namespace PIDs. Default: false | false |
| Name | Type | Description | Required |
|---|---|---|---|
| operator | enum | Filter operation. Enum: In, NotIn, Prefix, NotPrefix, Postfix, NotPostfix | true |
| values | []string | Value to compare the argument against. | true |
| followChildren | boolean | In addition to binaries, match children processes of specified binaries. Default: false | false |
| Name | Type | Description | Required |
|---|---|---|---|
| action | enum | Action to execute.
The Override action has three variants, depending on what arguments are set
1. Override the return value of function
Supported hooks: kprobes, uprobes, lsm
Arguments: ArgError (return value)
2. Override the value of a register
Supported hooks: uprobes
Arguments: ArgRegs
3. Override a function call
Supported hooks: uprobes
Arguments: One of:
- ArgNewSymbol: override call to a new symbol (in the binary)
- ArgNewAddr: override call to a new address (in the binary)
- ArgNewOffset: override call to an offset (in the binary) Enum: Post, Sigkill, Override, GetUrl, DnsLookup, NoPost, Signal, TrackSock, UntrackSock, NotifyEnforcer, CleanupEnforcerNotification, Set | true |
| argError | integer | error value for override action Format: int32 | false |
| argFqdn | string | A FQDN to lookup for the dnsLookup action | false |
| argIndex | integer | An arg index for the set action Format: int32 | false |
| argNewAddr | integer | An arg value for the override action, uprobe only.
The new symbol's address.
Beware that the symbol MUST be binary compatible with the traced uprobe symbol. Format: int64 | false |
| argNewOffset | integer | An arg value for the override action, uprobe only.
The new symbol's offset.
Beware that the symbol MUST be binary compatible with the traced uprobe symbol. Format: int64 | false |
| argNewSymbol | string | An arg value for the override action, uprobe only.
The new symbol name.
Beware that the symbol MUST be binary compatible with the traced uprobe symbol. | false |
| argRegs | []string | An arg value for the override action, uprobe only. | false |
| argSig | integer | A signal number for signal action Format: int32 | false |
| argSock | integer | An arg index for the sock for trackSock and untrackSock actions Format: int32 | false |
| argUrl | string | A URL for the getUrl action | false |
| argValue | integer | An arg value for the set action Format: int32 | false |
| imaHash | boolean | Enable collection of file hashes from integrity subsystem.
Only valid with the post action. | false |
| kernelStackTrace | boolean | Enable kernel stack trace export. Only valid with the post action. | false |
| rateLimit | string | A time period within which repeated messages will not be posted. Can be
specified in seconds (default or with 's' suffix), minutes ('m' suffix)
or hours ('h' suffix). Only valid with the post action. | false |
| rateLimitScope | string | The scope of the provided rate limit argument. Can be "thread" (default),
"process" (all threads for the same process), or "global". If "thread" is
selected then rate limiting applies per thread; if "process" is selected
then rate limiting applies per process; if "global" is selected then rate
limiting applies regardless of which process or thread caused the action.
Only valid with the post action and with a rateLimit specified. | false |
| userStackTrace | boolean | Enable user stack trace export. Only valid with the post action. | false |
| Name | Type | Description | Required |
|---|---|---|---|
| operator | enum | Filter operation. Enum: Equal, NotEqual, Prefix, NotPrefix, Postfix, NotPostfix, GreaterThan, LessThan, GT, LT, Mask, SPort, NotSPort, SPortPriv, NotSportPriv, DPort, NotDPort, DPortPriv, NotDPortPriv, SAddr, NotSAddr, DAddr, NotDAddr, Protocol, Family, State, InMap, NotInMap, CapabilitiesGained, InRange, NotInRange, SubString, SubStringIgnCase, CelExpr, FileType, NotFileType | true |
| args | []integer | Position of the operator arguments (in spec file) to apply the filter to. | false |
| index | integer | Position of the argument (in function prototype) to apply the filter to. Format: int32 Minimum: 0 | false |
| values | []string | Value to compare the argument against. | false |
Workloads to match
| Name | Type | Description | Required |
|---|---|---|---|
| containerSelector | object | ContainerSelector selects containers that this policy applies to.
A map of container fields will be constructed in the same way as a map of labels.
The name of the field represents the label "key", and the value of the field - label "value".
Currently, only the "name" field is supported. | false |
| hostSelector | object | HostSelector selects hosts that this policy applies to.
For now only ~ (none) and {} (all) is supported. Validations: | false |
| podSelector | object | PodSelector selects pods that this policy applies to | false |
ContainerSelector selects containers that this policy applies to. A map of container fields will be constructed in the same way as a map of labels. The name of the field represents the label “key”, and the value of the field - label “value”. Currently, only the “name” field is supported.
| Name | Type | Description | Required |
|---|---|---|---|
| matchExpressions | []object | matchExpressions is a list of label selector requirements. The requirements are ANDed. | false |
| matchLabels | map[string]string | matchLabels is a map of {key,value} pairs. A single {key,value} in the matchLabels
map is equivalent to an element of matchExpressions, whose key field is "key", the
operator is "In", and the values array contains only "value". The requirements are ANDed. | false |
A label selector requirement is a selector that contains values, a key, and an operator that relates the key and values.
| Name | Type | Description | Required |
|---|---|---|---|
| key | string | key is the label key that the selector applies to. | true |
| operator | enum | operator represents a key's relationship to a set of values.
Valid operators are In, NotIn, Exists and DoesNotExist. Enum: In, NotIn, Exists, DoesNotExist | true |
| values | []string | values is an array of string values. If the operator is In or NotIn,
the values array must be non-empty. If the operator is Exists or DoesNotExist,
the values array must be empty. This array is replaced during a strategic
merge patch. | false |
HostSelector selects hosts that this policy applies to. For now only ~ (none) and {} (all) is supported.
| Name | Type | Description | Required |
|---|---|---|---|
| matchExpressions | []object | matchExpressions is a list of label selector requirements. The requirements are ANDed. | false |
| matchLabels | map[string]string | matchLabels is a map of {key,value} pairs. A single {key,value} in the matchLabels
map is equivalent to an element of matchExpressions, whose key field is "key", the
operator is "In", and the values array contains only "value". The requirements are ANDed. | false |
A label selector requirement is a selector that contains values, a key, and an operator that relates the key and values.
| Name | Type | Description | Required |
|---|---|---|---|
| key | string | key is the label key that the selector applies to. | true |
| operator | enum | operator represents a key's relationship to a set of values.
Valid operators are In, NotIn, Exists and DoesNotExist. Enum: In, NotIn, Exists, DoesNotExist | true |
| values | []string | values is an array of string values. If the operator is In or NotIn,
the values array must be non-empty. If the operator is Exists or DoesNotExist,
the values array must be empty. This array is replaced during a strategic
merge patch. | false |
PodSelector selects pods that this policy applies to
| Name | Type | Description | Required |
|---|---|---|---|
| matchExpressions | []object | matchExpressions is a list of label selector requirements. The requirements are ANDed. | false |
| matchLabels | map[string]string | matchLabels is a map of {key,value} pairs. A single {key,value} in the matchLabels
map is equivalent to an element of matchExpressions, whose key field is "key", the
operator is "In", and the values array contains only "value". The requirements are ANDed. | false |
A label selector requirement is a selector that contains values, a key, and an operator that relates the key and values.
| Name | Type | Description | Required |
|---|---|---|---|
| key | string | key is the label key that the selector applies to. | true |
| operator | enum | operator represents a key's relationship to a set of values.
Valid operators are In, NotIn, Exists and DoesNotExist. Enum: In, NotIn, Exists, DoesNotExist | true |
| values | []string | values is an array of string values. If the operator is In or NotIn,
the values array must be non-empty. If the operator is Exists or DoesNotExist,
the values array must be empty. This array is replaced during a strategic
merge patch. | false |
NodeSelector selects the nodes, by label, on which Tetragon agents load this policy. If empty or unset, the policy is loaded on all nodes. This differs in purpose from hostSelector: nodeSelector controls where a policy is loaded (on which nodes), whereas hostSelector controls which workloads a loaded policy applies to (host vs pod workloads) and does not affect whether the policy is loaded on a node. Use nodeSelector to target a node group such as GPU nodes, a specific architecture or OS, or a canary pool; use hostSelector to scope a loaded policy to host workloads. Unlike hostSelector, nodeSelector supports arbitrary matchLabels and matchExpressions.
| Name | Type | Description | Required |
|---|---|---|---|
| matchExpressions | []object | matchExpressions is a list of label selector requirements. The requirements are ANDed. | false |
| matchLabels | map[string]string | matchLabels is a map of {key,value} pairs. A single {key,value} in the matchLabels
map is equivalent to an element of matchExpressions, whose key field is "key", the
operator is "In", and the values array contains only "value". The requirements are ANDed. | false |
A label selector requirement is a selector that contains values, a key, and an operator that relates the key and values.
| Name | Type | Description | Required |
|---|---|---|---|
| key | string | key is the label key that the selector applies to. | true |
| operator | enum | operator represents a key's relationship to a set of values.
Valid operators are In, NotIn, Exists and DoesNotExist. Enum: In, NotIn, Exists, DoesNotExist | true |
| values | []string | values is an array of string values. If the operator is In or NotIn,
the values array must be non-empty. If the operator is Exists or DoesNotExist,
the values array must be empty. This array is replaced during a strategic
merge patch. | false |
| Name | Type | Description | Required |
|---|---|---|---|
| name | string | Name of the option | true |
| value | string | Value of the option | false |
PodSelector selects pods that this policy applies to
| Name | Type | Description | Required |
|---|---|---|---|
| matchExpressions | []object | matchExpressions is a list of label selector requirements. The requirements are ANDed. | false |
| matchLabels | map[string]string | matchLabels is a map of {key,value} pairs. A single {key,value} in the matchLabels
map is equivalent to an element of matchExpressions, whose key field is "key", the
operator is "In", and the values array contains only "value". The requirements are ANDed. | false |
A label selector requirement is a selector that contains values, a key, and an operator that relates the key and values.
| Name | Type | Description | Required |
|---|---|---|---|
| key | string | key is the label key that the selector applies to. | true |
| operator | enum | operator represents a key's relationship to a set of values.
Valid operators are In, NotIn, Exists and DoesNotExist. Enum: In, NotIn, Exists, DoesNotExist | true |
| values | []string | values is an array of string values. If the operator is In or NotIn,
the values array must be non-empty. If the operator is Exists or DoesNotExist,
the values array must be empty. This array is replaced during a strategic
merge patch. | false |
KProbeSelector selects function calls for kprobe based on PIDs and function arguments. The results of MatchPIDs and MatchArgs are ANDed.
| Name | Type | Description | Required |
|---|---|---|---|
| label | string | Human-readable selector label used in status and metrics. | false |
| macros | []string | A list of macros names, defined in spec.selectorsMacros.
Filters specified in macros will be appended to corresponding filters of the selector. | false |
| matchActions | []object | A list of actions to execute when this selector matches | false |
| matchArgs | []object | A list of argument filters. MatchArgs are ANDed. | false |
| matchBinaries | []object | A list of binary exec name filters. | false |
| matchCapabilities | []object | A list of capabilities and IDs | false |
| matchCapabilityChanges | []object | IDs for capabilities changes | false |
| matchData | []object | A list of argument filters. MatchData are ANDed. | false |
| matchNamespaceChanges | []object | IDs for namespace changes | false |
| matchNamespaces | []object | A list of namespaces and IDs | false |
| matchPIDs | []object | A list of process ID filters. MatchPIDs are ANDed. | false |
| matchParentBinaries | []object | A list of process parent exec name filters. | false |
| matchReturnActions | []object | A list of actions to execute when MatchReturnArgs selector matches | false |
| matchReturnArgs | []object | A list of argument filters. MatchReturnArgs are ANDed. | false |
| matchWorkloads | object | Workloads to match | false |
| Name | Type | Description | Required |
|---|---|---|---|
| action | enum | Action to execute.
The Override action has three variants, depending on what arguments are set
1. Override the return value of function
Supported hooks: kprobes, uprobes, lsm
Arguments: ArgError (return value)
2. Override the value of a register
Supported hooks: uprobes
Arguments: ArgRegs
3. Override a function call
Supported hooks: uprobes
Arguments: One of:
- ArgNewSymbol: override call to a new symbol (in the binary)
- ArgNewAddr: override call to a new address (in the binary)
- ArgNewOffset: override call to an offset (in the binary) Enum: Post, Sigkill, Override, GetUrl, DnsLookup, NoPost, Signal, TrackSock, UntrackSock, NotifyEnforcer, CleanupEnforcerNotification, Set | true |
| argError | integer | error value for override action Format: int32 | false |
| argFqdn | string | A FQDN to lookup for the dnsLookup action | false |
| argIndex | integer | An arg index for the set action Format: int32 | false |
| argNewAddr | integer | An arg value for the override action, uprobe only.
The new symbol's address.
Beware that the symbol MUST be binary compatible with the traced uprobe symbol. Format: int64 | false |
| argNewOffset | integer | An arg value for the override action, uprobe only.
The new symbol's offset.
Beware that the symbol MUST be binary compatible with the traced uprobe symbol. Format: int64 | false |
| argNewSymbol | string | An arg value for the override action, uprobe only.
The new symbol name.
Beware that the symbol MUST be binary compatible with the traced uprobe symbol. | false |
| argRegs | []string | An arg value for the override action, uprobe only. | false |
| argSig | integer | A signal number for signal action Format: int32 | false |
| argSock | integer | An arg index for the sock for trackSock and untrackSock actions Format: int32 | false |
| argUrl | string | A URL for the getUrl action | false |
| argValue | integer | An arg value for the set action Format: int32 | false |
| imaHash | boolean | Enable collection of file hashes from integrity subsystem.
Only valid with the post action. | false |
| kernelStackTrace | boolean | Enable kernel stack trace export. Only valid with the post action. | false |
| rateLimit | string | A time period within which repeated messages will not be posted. Can be
specified in seconds (default or with 's' suffix), minutes ('m' suffix)
or hours ('h' suffix). Only valid with the post action. | false |
| rateLimitScope | string | The scope of the provided rate limit argument. Can be "thread" (default),
"process" (all threads for the same process), or "global". If "thread" is
selected then rate limiting applies per thread; if "process" is selected
then rate limiting applies per process; if "global" is selected then rate
limiting applies regardless of which process or thread caused the action.
Only valid with the post action and with a rateLimit specified. | false |
| userStackTrace | boolean | Enable user stack trace export. Only valid with the post action. | false |
| Name | Type | Description | Required |
|---|---|---|---|
| operator | enum | Filter operation. Enum: Equal, NotEqual, Prefix, NotPrefix, Postfix, NotPostfix, GreaterThan, LessThan, GT, LT, Mask, SPort, NotSPort, SPortPriv, NotSportPriv, DPort, NotDPort, DPortPriv, NotDPortPriv, SAddr, NotSAddr, DAddr, NotDAddr, Protocol, Family, State, InMap, NotInMap, CapabilitiesGained, InRange, NotInRange, SubString, SubStringIgnCase, CelExpr, FileType, NotFileType | true |
| args | []integer | Position of the operator arguments (in spec file) to apply the filter to. | false |
| index | integer | Position of the argument (in function prototype) to apply the filter to. Format: int32 Minimum: 0 | false |
| values | []string | Value to compare the argument against. | false |
| Name | Type | Description | Required |
|---|---|---|---|
| operator | enum | Filter operation. Enum: In, NotIn, Prefix, NotPrefix, Postfix, NotPostfix | true |
| values | []string | Value to compare the argument against. | true |
| followChildren | boolean | In addition to binaries, match children processes of specified binaries. Default: false | false |
| Name | Type | Description | Required |
|---|---|---|---|
| operator | enum | Namespace selector operator. Enum: In, NotIn | true |
| values | []string | Capabilities to match. | true |
| isNamespaceCapability | boolean | Indicates whether these caps are namespace caps. Default: false | false |
| type | enum | Type of capabilities Enum: Effective, Inheritable, Permitted Default: Effective | false |
| Name | Type | Description | Required |
|---|---|---|---|
| operator | enum | Namespace selector operator. Enum: In, NotIn | true |
| values | []string | Capabilities to match. | true |
| isNamespaceCapability | boolean | Indicates whether these caps are namespace caps. Default: false | false |
| type | enum | Type of capabilities Enum: Effective, Inheritable, Permitted Default: Effective | false |
| Name | Type | Description | Required |
|---|---|---|---|
| operator | enum | Filter operation. Enum: Equal, NotEqual, Prefix, NotPrefix, Postfix, NotPostfix, GreaterThan, LessThan, GT, LT, Mask, SPort, NotSPort, SPortPriv, NotSportPriv, DPort, NotDPort, DPortPriv, NotDPortPriv, SAddr, NotSAddr, DAddr, NotDAddr, Protocol, Family, State, InMap, NotInMap, CapabilitiesGained, InRange, NotInRange, SubString, SubStringIgnCase, CelExpr, FileType, NotFileType | true |
| args | []integer | Position of the operator arguments (in spec file) to apply the filter to. | false |
| index | integer | Position of the argument (in function prototype) to apply the filter to. Format: int32 Minimum: 0 | false |
| values | []string | Value to compare the argument against. | false |
| Name | Type | Description | Required |
|---|---|---|---|
| operator | enum | Namespace selector operator. Enum: In, NotIn | true |
| values | []string | Namespace types (e.g., Mnt, Pid) to match. | true |
| Name | Type | Description | Required |
|---|---|---|---|
| namespace | enum | Namespace selector name. Enum: Uts, Ipc, Mnt, Pid, PidForChildren, Net, Time, TimeForChildren, Cgroup, User | true |
| operator | enum | Namespace selector operator. Enum: In, NotIn | true |
| values | []string | Namespace IDs (or host_ns for host namespace) of namespaces to match. | true |
| Name | Type | Description | Required |
|---|---|---|---|
| operator | enum | PID selector operator. Enum: In, NotIn | true |
| values | []integer | Process IDs to match. | true |
| followForks | boolean | Matches any descendant processes of the matching PIDs. Default: false | false |
| isNamespacePID | boolean | Indicates whether PIDs are namespace PIDs. Default: false | false |
| Name | Type | Description | Required |
|---|---|---|---|
| operator | enum | Filter operation. Enum: In, NotIn, Prefix, NotPrefix, Postfix, NotPostfix | true |
| values | []string | Value to compare the argument against. | true |
| followChildren | boolean | In addition to binaries, match children processes of specified binaries. Default: false | false |
| Name | Type | Description | Required |
|---|---|---|---|
| action | enum | Action to execute.
The Override action has three variants, depending on what arguments are set
1. Override the return value of function
Supported hooks: kprobes, uprobes, lsm
Arguments: ArgError (return value)
2. Override the value of a register
Supported hooks: uprobes
Arguments: ArgRegs
3. Override a function call
Supported hooks: uprobes
Arguments: One of:
- ArgNewSymbol: override call to a new symbol (in the binary)
- ArgNewAddr: override call to a new address (in the binary)
- ArgNewOffset: override call to an offset (in the binary) Enum: Post, Sigkill, Override, GetUrl, DnsLookup, NoPost, Signal, TrackSock, UntrackSock, NotifyEnforcer, CleanupEnforcerNotification, Set | true |
| argError | integer | error value for override action Format: int32 | false |
| argFqdn | string | A FQDN to lookup for the dnsLookup action | false |
| argIndex | integer | An arg index for the set action Format: int32 | false |
| argNewAddr | integer | An arg value for the override action, uprobe only.
The new symbol's address.
Beware that the symbol MUST be binary compatible with the traced uprobe symbol. Format: int64 | false |
| argNewOffset | integer | An arg value for the override action, uprobe only.
The new symbol's offset.
Beware that the symbol MUST be binary compatible with the traced uprobe symbol. Format: int64 | false |
| argNewSymbol | string | An arg value for the override action, uprobe only.
The new symbol name.
Beware that the symbol MUST be binary compatible with the traced uprobe symbol. | false |
| argRegs | []string | An arg value for the override action, uprobe only. | false |
| argSig | integer | A signal number for signal action Format: int32 | false |
| argSock | integer | An arg index for the sock for trackSock and untrackSock actions Format: int32 | false |
| argUrl | string | A URL for the getUrl action | false |
| argValue | integer | An arg value for the set action Format: int32 | false |
| imaHash | boolean | Enable collection of file hashes from integrity subsystem.
Only valid with the post action. | false |
| kernelStackTrace | boolean | Enable kernel stack trace export. Only valid with the post action. | false |
| rateLimit | string | A time period within which repeated messages will not be posted. Can be
specified in seconds (default or with 's' suffix), minutes ('m' suffix)
or hours ('h' suffix). Only valid with the post action. | false |
| rateLimitScope | string | The scope of the provided rate limit argument. Can be "thread" (default),
"process" (all threads for the same process), or "global". If "thread" is
selected then rate limiting applies per thread; if "process" is selected
then rate limiting applies per process; if "global" is selected then rate
limiting applies regardless of which process or thread caused the action.
Only valid with the post action and with a rateLimit specified. | false |
| userStackTrace | boolean | Enable user stack trace export. Only valid with the post action. | false |
| Name | Type | Description | Required |
|---|---|---|---|
| operator | enum | Filter operation. Enum: Equal, NotEqual, Prefix, NotPrefix, Postfix, NotPostfix, GreaterThan, LessThan, GT, LT, Mask, SPort, NotSPort, SPortPriv, NotSportPriv, DPort, NotDPort, DPortPriv, NotDPortPriv, SAddr, NotSAddr, DAddr, NotDAddr, Protocol, Family, State, InMap, NotInMap, CapabilitiesGained, InRange, NotInRange, SubString, SubStringIgnCase, CelExpr, FileType, NotFileType | true |
| args | []integer | Position of the operator arguments (in spec file) to apply the filter to. | false |
| index | integer | Position of the argument (in function prototype) to apply the filter to. Format: int32 Minimum: 0 | false |
| values | []string | Value to compare the argument against. | false |
Workloads to match
| Name | Type | Description | Required |
|---|---|---|---|
| containerSelector | object | ContainerSelector selects containers that this policy applies to.
A map of container fields will be constructed in the same way as a map of labels.
The name of the field represents the label "key", and the value of the field - label "value".
Currently, only the "name" field is supported. | false |
| hostSelector | object | HostSelector selects hosts that this policy applies to.
For now only ~ (none) and {} (all) is supported. Validations: | false |
| podSelector | object | PodSelector selects pods that this policy applies to | false |
ContainerSelector selects containers that this policy applies to. A map of container fields will be constructed in the same way as a map of labels. The name of the field represents the label “key”, and the value of the field - label “value”. Currently, only the “name” field is supported.
| Name | Type | Description | Required |
|---|---|---|---|
| matchExpressions | []object | matchExpressions is a list of label selector requirements. The requirements are ANDed. | false |
| matchLabels | map[string]string | matchLabels is a map of {key,value} pairs. A single {key,value} in the matchLabels
map is equivalent to an element of matchExpressions, whose key field is "key", the
operator is "In", and the values array contains only "value". The requirements are ANDed. | false |
A label selector requirement is a selector that contains values, a key, and an operator that relates the key and values.
| Name | Type | Description | Required |
|---|---|---|---|
| key | string | key is the label key that the selector applies to. | true |
| operator | enum | operator represents a key's relationship to a set of values.
Valid operators are In, NotIn, Exists and DoesNotExist. Enum: In, NotIn, Exists, DoesNotExist | true |
| values | []string | values is an array of string values. If the operator is In or NotIn,
the values array must be non-empty. If the operator is Exists or DoesNotExist,
the values array must be empty. This array is replaced during a strategic
merge patch. | false |
HostSelector selects hosts that this policy applies to. For now only ~ (none) and {} (all) is supported.
| Name | Type | Description | Required |
|---|---|---|---|
| matchExpressions | []object | matchExpressions is a list of label selector requirements. The requirements are ANDed. | false |
| matchLabels | map[string]string | matchLabels is a map of {key,value} pairs. A single {key,value} in the matchLabels
map is equivalent to an element of matchExpressions, whose key field is "key", the
operator is "In", and the values array contains only "value". The requirements are ANDed. | false |
A label selector requirement is a selector that contains values, a key, and an operator that relates the key and values.
| Name | Type | Description | Required |
|---|---|---|---|
| key | string | key is the label key that the selector applies to. | true |
| operator | enum | operator represents a key's relationship to a set of values.
Valid operators are In, NotIn, Exists and DoesNotExist. Enum: In, NotIn, Exists, DoesNotExist | true |
| values | []string | values is an array of string values. If the operator is In or NotIn,
the values array must be non-empty. If the operator is Exists or DoesNotExist,
the values array must be empty. This array is replaced during a strategic
merge patch. | false |
PodSelector selects pods that this policy applies to
| Name | Type | Description | Required |
|---|---|---|---|
| matchExpressions | []object | matchExpressions is a list of label selector requirements. The requirements are ANDed. | false |
| matchLabels | map[string]string | matchLabels is a map of {key,value} pairs. A single {key,value} in the matchLabels
map is equivalent to an element of matchExpressions, whose key field is "key", the
operator is "In", and the values array contains only "value". The requirements are ANDed. | false |
A label selector requirement is a selector that contains values, a key, and an operator that relates the key and values.
| Name | Type | Description | Required |
|---|---|---|---|
| key | string | key is the label key that the selector applies to. | true |
| operator | enum | operator represents a key's relationship to a set of values.
Valid operators are In, NotIn, Exists and DoesNotExist. Enum: In, NotIn, Exists, DoesNotExist | true |
| values | []string | values is an array of string values. If the operator is In or NotIn,
the values array must be non-empty. If the operator is Exists or DoesNotExist,
the values array must be empty. This array is replaced during a strategic
merge patch. | false |
| Name | Type | Description | Required |
|---|---|---|---|
| event | string | Tracepoint event | true |
| subsystem | string | Tracepoint subsystem | true |
| args | []object | A list of function arguments to include in the trace output. | false |
| message | string | A short message of 256 characters max that will be included
in the event output to inform users what is going on. | false |
| raw | boolean | Enable raw tracepoint arguments | false |
| selectors | []object | Selectors to apply before producing trace output. Selectors are ORed. | false |
| tags | []string | Tags to categorize the event, will be include in the event output.
Maximum of 16 Tags are supported. | false |
| Name | Type | Description | Required |
|---|---|---|---|
| index | integer | Position of the argument. Format: int32 Minimum: 0 | true |
| type | enum | Argument type. Enum: auto, int, sint8, int8, uint8, sint16, int16, uint16, uint32, sint32, int32, ulong, uint64, size_t, long, sint64, int64, char_buf, char_iovec, skb, sock, sockaddr, socket, sockaddr_un, string, fd, file, filename, path, nop, bpf_attr, perf_event, bpf_map, user_namespace, capability, kiocb, iov_iter, cred, const_buf, load_info, module, syscall64, kernel_cap_t, cap_inheritable, cap_permitted, cap_effective, linux_binprm, data_loc, net_device, bpf_cmd, dentry, bpf_prog Default: auto | true |
| btfType | string | Type to use as the initial resolve type. For kprobe args it looks up the named struct
from the kernel BTF, casting the argument's type before traversing the resolve path.
For UprobeSpecs and UsdtSpecs it looks up the type from the BTF file defined by BTFPath. | false |
| btfTypeModule | string | Kernel module that contains the BTFType. This is used only for kprobe args.
The module must already be loaded and expose BTF in /sys/kernel/btf. | false |
| label | string | Label to output in the JSON | false |
| maxData | boolean | Read maximum possible data (currently 327360). This field is only used
for char_buff data. When this value is false (default), the bpf program
will fetch at most 4096 bytes. In later kernels (>=5.4) tetragon
supports fetching up to 327360 bytes if this flag is turned on Default: false | false |
| resolve | string | Resolve the path to a specific attribute Default: | false |
| returnCopy | boolean | This field is used only for char_buf and char_iovec types. It indicates
that this argument should be read later (when the kretprobe for the
symbol is triggered) because it might not be populated when the kprobe
is triggered at the entrance of the function. For example, a buffer
supplied to read(2) won't have content until kretprobe is triggered. Default: false | false |
| sizeArgIndex | integer | Specifies the position of the corresponding size argument for this argument.
This field is used only for char_buf and char_iovec types. Format: int32 Minimum: 0 | false |
| source | string | Source of the data, if missing the default if function arguments | false |
KProbeSelector selects function calls for kprobe based on PIDs and function arguments. The results of MatchPIDs and MatchArgs are ANDed.
| Name | Type | Description | Required |
|---|---|---|---|
| label | string | Human-readable selector label used in status and metrics. | false |
| macros | []string | A list of macros names, defined in spec.selectorsMacros.
Filters specified in macros will be appended to corresponding filters of the selector. | false |
| matchActions | []object | A list of actions to execute when this selector matches | false |
| matchArgs | []object | A list of argument filters. MatchArgs are ANDed. | false |
| matchBinaries | []object | A list of binary exec name filters. | false |
| matchCapabilities | []object | A list of capabilities and IDs | false |
| matchCapabilityChanges | []object | IDs for capabilities changes | false |
| matchData | []object | A list of argument filters. MatchData are ANDed. | false |
| matchNamespaceChanges | []object | IDs for namespace changes | false |
| matchNamespaces | []object | A list of namespaces and IDs | false |
| matchPIDs | []object | A list of process ID filters. MatchPIDs are ANDed. | false |
| matchParentBinaries | []object | A list of process parent exec name filters. | false |
| matchReturnActions | []object | A list of actions to execute when MatchReturnArgs selector matches | false |
| matchReturnArgs | []object | A list of argument filters. MatchReturnArgs are ANDed. | false |
| matchWorkloads | object | Workloads to match | false |
| Name | Type | Description | Required |
|---|---|---|---|
| action | enum | Action to execute.
The Override action has three variants, depending on what arguments are set
1. Override the return value of function
Supported hooks: kprobes, uprobes, lsm
Arguments: ArgError (return value)
2. Override the value of a register
Supported hooks: uprobes
Arguments: ArgRegs
3. Override a function call
Supported hooks: uprobes
Arguments: One of:
- ArgNewSymbol: override call to a new symbol (in the binary)
- ArgNewAddr: override call to a new address (in the binary)
- ArgNewOffset: override call to an offset (in the binary) Enum: Post, Sigkill, Override, GetUrl, DnsLookup, NoPost, Signal, TrackSock, UntrackSock, NotifyEnforcer, CleanupEnforcerNotification, Set | true |
| argError | integer | error value for override action Format: int32 | false |
| argFqdn | string | A FQDN to lookup for the dnsLookup action | false |
| argIndex | integer | An arg index for the set action Format: int32 | false |
| argNewAddr | integer | An arg value for the override action, uprobe only.
The new symbol's address.
Beware that the symbol MUST be binary compatible with the traced uprobe symbol. Format: int64 | false |
| argNewOffset | integer | An arg value for the override action, uprobe only.
The new symbol's offset.
Beware that the symbol MUST be binary compatible with the traced uprobe symbol. Format: int64 | false |
| argNewSymbol | string | An arg value for the override action, uprobe only.
The new symbol name.
Beware that the symbol MUST be binary compatible with the traced uprobe symbol. | false |
| argRegs | []string | An arg value for the override action, uprobe only. | false |
| argSig | integer | A signal number for signal action Format: int32 | false |
| argSock | integer | An arg index for the sock for trackSock and untrackSock actions Format: int32 | false |
| argUrl | string | A URL for the getUrl action | false |
| argValue | integer | An arg value for the set action Format: int32 | false |
| imaHash | boolean | Enable collection of file hashes from integrity subsystem.
Only valid with the post action. | false |
| kernelStackTrace | boolean | Enable kernel stack trace export. Only valid with the post action. | false |
| rateLimit | string | A time period within which repeated messages will not be posted. Can be
specified in seconds (default or with 's' suffix), minutes ('m' suffix)
or hours ('h' suffix). Only valid with the post action. | false |
| rateLimitScope | string | The scope of the provided rate limit argument. Can be "thread" (default),
"process" (all threads for the same process), or "global". If "thread" is
selected then rate limiting applies per thread; if "process" is selected
then rate limiting applies per process; if "global" is selected then rate
limiting applies regardless of which process or thread caused the action.
Only valid with the post action and with a rateLimit specified. | false |
| userStackTrace | boolean | Enable user stack trace export. Only valid with the post action. | false |
| Name | Type | Description | Required |
|---|---|---|---|
| operator | enum | Filter operation. Enum: Equal, NotEqual, Prefix, NotPrefix, Postfix, NotPostfix, GreaterThan, LessThan, GT, LT, Mask, SPort, NotSPort, SPortPriv, NotSportPriv, DPort, NotDPort, DPortPriv, NotDPortPriv, SAddr, NotSAddr, DAddr, NotDAddr, Protocol, Family, State, InMap, NotInMap, CapabilitiesGained, InRange, NotInRange, SubString, SubStringIgnCase, CelExpr, FileType, NotFileType | true |
| args | []integer | Position of the operator arguments (in spec file) to apply the filter to. | false |
| index | integer | Position of the argument (in function prototype) to apply the filter to. Format: int32 Minimum: 0 | false |
| values | []string | Value to compare the argument against. | false |
| Name | Type | Description | Required |
|---|---|---|---|
| operator | enum | Filter operation. Enum: In, NotIn, Prefix, NotPrefix, Postfix, NotPostfix | true |
| values | []string | Value to compare the argument against. | true |
| followChildren | boolean | In addition to binaries, match children processes of specified binaries. Default: false | false |
| Name | Type | Description | Required |
|---|---|---|---|
| operator | enum | Namespace selector operator. Enum: In, NotIn | true |
| values | []string | Capabilities to match. | true |
| isNamespaceCapability | boolean | Indicates whether these caps are namespace caps. Default: false | false |
| type | enum | Type of capabilities Enum: Effective, Inheritable, Permitted Default: Effective | false |
| Name | Type | Description | Required |
|---|---|---|---|
| operator | enum | Namespace selector operator. Enum: In, NotIn | true |
| values | []string | Capabilities to match. | true |
| isNamespaceCapability | boolean | Indicates whether these caps are namespace caps. Default: false | false |
| type | enum | Type of capabilities Enum: Effective, Inheritable, Permitted Default: Effective | false |
| Name | Type | Description | Required |
|---|---|---|---|
| operator | enum | Filter operation. Enum: Equal, NotEqual, Prefix, NotPrefix, Postfix, NotPostfix, GreaterThan, LessThan, GT, LT, Mask, SPort, NotSPort, SPortPriv, NotSportPriv, DPort, NotDPort, DPortPriv, NotDPortPriv, SAddr, NotSAddr, DAddr, NotDAddr, Protocol, Family, State, InMap, NotInMap, CapabilitiesGained, InRange, NotInRange, SubString, SubStringIgnCase, CelExpr, FileType, NotFileType | true |
| args | []integer | Position of the operator arguments (in spec file) to apply the filter to. | false |
| index | integer | Position of the argument (in function prototype) to apply the filter to. Format: int32 Minimum: 0 | false |
| values | []string | Value to compare the argument against. | false |
| Name | Type | Description | Required |
|---|---|---|---|
| operator | enum | Namespace selector operator. Enum: In, NotIn | true |
| values | []string | Namespace types (e.g., Mnt, Pid) to match. | true |
| Name | Type | Description | Required |
|---|---|---|---|
| namespace | enum | Namespace selector name. Enum: Uts, Ipc, Mnt, Pid, PidForChildren, Net, Time, TimeForChildren, Cgroup, User | true |
| operator | enum | Namespace selector operator. Enum: In, NotIn | true |
| values | []string | Namespace IDs (or host_ns for host namespace) of namespaces to match. | true |
| Name | Type | Description | Required |
|---|---|---|---|
| operator | enum | PID selector operator. Enum: In, NotIn | true |
| values | []integer | Process IDs to match. | true |
| followForks | boolean | Matches any descendant processes of the matching PIDs. Default: false | false |
| isNamespacePID | boolean | Indicates whether PIDs are namespace PIDs. Default: false | false |
| Name | Type | Description | Required |
|---|---|---|---|
| operator | enum | Filter operation. Enum: In, NotIn, Prefix, NotPrefix, Postfix, NotPostfix | true |
| values | []string | Value to compare the argument against. | true |
| followChildren | boolean | In addition to binaries, match children processes of specified binaries. Default: false | false |
| Name | Type | Description | Required |
|---|---|---|---|
| action | enum | Action to execute.
The Override action has three variants, depending on what arguments are set
1. Override the return value of function
Supported hooks: kprobes, uprobes, lsm
Arguments: ArgError (return value)
2. Override the value of a register
Supported hooks: uprobes
Arguments: ArgRegs
3. Override a function call
Supported hooks: uprobes
Arguments: One of:
- ArgNewSymbol: override call to a new symbol (in the binary)
- ArgNewAddr: override call to a new address (in the binary)
- ArgNewOffset: override call to an offset (in the binary) Enum: Post, Sigkill, Override, GetUrl, DnsLookup, NoPost, Signal, TrackSock, UntrackSock, NotifyEnforcer, CleanupEnforcerNotification, Set | true |
| argError | integer | error value for override action Format: int32 | false |
| argFqdn | string | A FQDN to lookup for the dnsLookup action | false |
| argIndex | integer | An arg index for the set action Format: int32 | false |
| argNewAddr | integer | An arg value for the override action, uprobe only.
The new symbol's address.
Beware that the symbol MUST be binary compatible with the traced uprobe symbol. Format: int64 | false |
| argNewOffset | integer | An arg value for the override action, uprobe only.
The new symbol's offset.
Beware that the symbol MUST be binary compatible with the traced uprobe symbol. Format: int64 | false |
| argNewSymbol | string | An arg value for the override action, uprobe only.
The new symbol name.
Beware that the symbol MUST be binary compatible with the traced uprobe symbol. | false |
| argRegs | []string | An arg value for the override action, uprobe only. | false |
| argSig | integer | A signal number for signal action Format: int32 | false |
| argSock | integer | An arg index for the sock for trackSock and untrackSock actions Format: int32 | false |
| argUrl | string | A URL for the getUrl action | false |
| argValue | integer | An arg value for the set action Format: int32 | false |
| imaHash | boolean | Enable collection of file hashes from integrity subsystem.
Only valid with the post action. | false |
| kernelStackTrace | boolean | Enable kernel stack trace export. Only valid with the post action. | false |
| rateLimit | string | A time period within which repeated messages will not be posted. Can be
specified in seconds (default or with 's' suffix), minutes ('m' suffix)
or hours ('h' suffix). Only valid with the post action. | false |
| rateLimitScope | string | The scope of the provided rate limit argument. Can be "thread" (default),
"process" (all threads for the same process), or "global". If "thread" is
selected then rate limiting applies per thread; if "process" is selected
then rate limiting applies per process; if "global" is selected then rate
limiting applies regardless of which process or thread caused the action.
Only valid with the post action and with a rateLimit specified. | false |
| userStackTrace | boolean | Enable user stack trace export. Only valid with the post action. | false |
| Name | Type | Description | Required |
|---|---|---|---|
| operator | enum | Filter operation. Enum: Equal, NotEqual, Prefix, NotPrefix, Postfix, NotPostfix, GreaterThan, LessThan, GT, LT, Mask, SPort, NotSPort, SPortPriv, NotSportPriv, DPort, NotDPort, DPortPriv, NotDPortPriv, SAddr, NotSAddr, DAddr, NotDAddr, Protocol, Family, State, InMap, NotInMap, CapabilitiesGained, InRange, NotInRange, SubString, SubStringIgnCase, CelExpr, FileType, NotFileType | true |
| args | []integer | Position of the operator arguments (in spec file) to apply the filter to. | false |
| index | integer | Position of the argument (in function prototype) to apply the filter to. Format: int32 Minimum: 0 | false |
| values | []string | Value to compare the argument against. | false |
Workloads to match
| Name | Type | Description | Required |
|---|---|---|---|
| containerSelector | object | ContainerSelector selects containers that this policy applies to.
A map of container fields will be constructed in the same way as a map of labels.
The name of the field represents the label "key", and the value of the field - label "value".
Currently, only the "name" field is supported. | false |
| hostSelector | object | HostSelector selects hosts that this policy applies to.
For now only ~ (none) and {} (all) is supported. Validations: | false |
| podSelector | object | PodSelector selects pods that this policy applies to | false |
ContainerSelector selects containers that this policy applies to. A map of container fields will be constructed in the same way as a map of labels. The name of the field represents the label “key”, and the value of the field - label “value”. Currently, only the “name” field is supported.
| Name | Type | Description | Required |
|---|---|---|---|
| matchExpressions | []object | matchExpressions is a list of label selector requirements. The requirements are ANDed. | false |
| matchLabels | map[string]string | matchLabels is a map of {key,value} pairs. A single {key,value} in the matchLabels
map is equivalent to an element of matchExpressions, whose key field is "key", the
operator is "In", and the values array contains only "value". The requirements are ANDed. | false |
A label selector requirement is a selector that contains values, a key, and an operator that relates the key and values.
| Name | Type | Description | Required |
|---|---|---|---|
| key | string | key is the label key that the selector applies to. | true |
| operator | enum | operator represents a key's relationship to a set of values.
Valid operators are In, NotIn, Exists and DoesNotExist. Enum: In, NotIn, Exists, DoesNotExist | true |
| values | []string | values is an array of string values. If the operator is In or NotIn,
the values array must be non-empty. If the operator is Exists or DoesNotExist,
the values array must be empty. This array is replaced during a strategic
merge patch. | false |
HostSelector selects hosts that this policy applies to. For now only ~ (none) and {} (all) is supported.
| Name | Type | Description | Required |
|---|---|---|---|
| matchExpressions | []object | matchExpressions is a list of label selector requirements. The requirements are ANDed. | false |
| matchLabels | map[string]string | matchLabels is a map of {key,value} pairs. A single {key,value} in the matchLabels
map is equivalent to an element of matchExpressions, whose key field is "key", the
operator is "In", and the values array contains only "value". The requirements are ANDed. | false |
A label selector requirement is a selector that contains values, a key, and an operator that relates the key and values.
| Name | Type | Description | Required |
|---|---|---|---|
| key | string | key is the label key that the selector applies to. | true |
| operator | enum | operator represents a key's relationship to a set of values.
Valid operators are In, NotIn, Exists and DoesNotExist. Enum: In, NotIn, Exists, DoesNotExist | true |
| values | []string | values is an array of string values. If the operator is In or NotIn,
the values array must be non-empty. If the operator is Exists or DoesNotExist,
the values array must be empty. This array is replaced during a strategic
merge patch. | false |
PodSelector selects pods that this policy applies to
| Name | Type | Description | Required |
|---|---|---|---|
| matchExpressions | []object | matchExpressions is a list of label selector requirements. The requirements are ANDed. | false |
| matchLabels | map[string]string | matchLabels is a map of {key,value} pairs. A single {key,value} in the matchLabels
map is equivalent to an element of matchExpressions, whose key field is "key", the
operator is "In", and the values array contains only "value". The requirements are ANDed. | false |
A label selector requirement is a selector that contains values, a key, and an operator that relates the key and values.
| Name | Type | Description | Required |
|---|---|---|---|
| key | string | key is the label key that the selector applies to. | true |
| operator | enum | operator represents a key's relationship to a set of values.
Valid operators are In, NotIn, Exists and DoesNotExist. Enum: In, NotIn, Exists, DoesNotExist | true |
| values | []string | values is an array of string values. If the operator is In or NotIn,
the values array must be non-empty. If the operator is Exists or DoesNotExist,
the values array must be empty. This array is replaced during a strategic
merge patch. | false |
| Name | Type | Description | Required |
|---|---|---|---|
| path | string | Name of the traced binary | true |
| addrs | []integer | List of the traced addresses | false |
| args | []object | A list of function arguments to include in the trace output. | false |
| binaryDigests | []string | BinaryDigests specifies a set of digests for the traced binary.
The uprobe/hook is installed only if the digest of the traced binary matches a digest in the set.
Tetragon's tracing policy status API can be used to see each hook's status in order to determine
if the hook was attached or not. | false |
| btfPath | string | path for a BTF file for the traced binary | false |
| data | []object | A list of data to include in the trace output. | false |
| ignore | object | Conditions for ignoring this uprobe | false |
| message | string | A short message of 256 characters max that will be included
in the event output to inform users what is going on. | false |
| offsets | []integer | List of the traced offsets | false |
| refCtrOffsets | []integer | List of the traced ref_ctr_offsets | false |
| return | boolean | Indicates whether to collect return value of the traced function. Default: false | false |
| returnArg | object | A return argument to include in the trace output. | false |
| selectors | []object | Selectors to apply before producing trace output. Selectors are ORed. | false |
| symbols | []string | List of the traced symbols | false |
| tags | []string | Tags to categorize the event, will be include in the event output.
Maximum of 16 Tags are supported. | false |
| Name | Type | Description | Required |
|---|---|---|---|
| index | integer | Position of the argument. Format: int32 Minimum: 0 | true |
| type | enum | Argument type. Enum: auto, int, sint8, int8, uint8, sint16, int16, uint16, uint32, sint32, int32, ulong, uint64, size_t, long, sint64, int64, char_buf, char_iovec, skb, sock, sockaddr, socket, sockaddr_un, string, fd, file, filename, path, nop, bpf_attr, perf_event, bpf_map, user_namespace, capability, kiocb, iov_iter, cred, const_buf, load_info, module, syscall64, kernel_cap_t, cap_inheritable, cap_permitted, cap_effective, linux_binprm, data_loc, net_device, bpf_cmd, dentry, bpf_prog Default: auto | true |
| btfType | string | Type to use as the initial resolve type. For kprobe args it looks up the named struct
from the kernel BTF, casting the argument's type before traversing the resolve path.
For UprobeSpecs and UsdtSpecs it looks up the type from the BTF file defined by BTFPath. | false |
| btfTypeModule | string | Kernel module that contains the BTFType. This is used only for kprobe args.
The module must already be loaded and expose BTF in /sys/kernel/btf. | false |
| label | string | Label to output in the JSON | false |
| maxData | boolean | Read maximum possible data (currently 327360). This field is only used
for char_buff data. When this value is false (default), the bpf program
will fetch at most 4096 bytes. In later kernels (>=5.4) tetragon
supports fetching up to 327360 bytes if this flag is turned on Default: false | false |
| resolve | string | Resolve the path to a specific attribute Default: | false |
| returnCopy | boolean | This field is used only for char_buf and char_iovec types. It indicates
that this argument should be read later (when the kretprobe for the
symbol is triggered) because it might not be populated when the kprobe
is triggered at the entrance of the function. For example, a buffer
supplied to read(2) won't have content until kretprobe is triggered. Default: false | false |
| sizeArgIndex | integer | Specifies the position of the corresponding size argument for this argument.
This field is used only for char_buf and char_iovec types. Format: int32 Minimum: 0 | false |
| source | string | Source of the data, if missing the default if function arguments | false |
Conditions for ignoring this uprobe
| Name | Type | Description | Required |
|---|---|---|---|
| digestVerificationFailure | boolean | Ignores uprobe where the digest verification of the traced binary fails | false |
A return argument to include in the trace output.
| Name | Type | Description | Required |
|---|---|---|---|
| index | integer | Position of the argument. Format: int32 Minimum: 0 | true |
| type | enum | Argument type. Enum: auto, int, sint8, int8, uint8, sint16, int16, uint16, uint32, sint32, int32, ulong, uint64, size_t, long, sint64, int64, char_buf, char_iovec, skb, sock, sockaddr, socket, sockaddr_un, string, fd, file, filename, path, nop, bpf_attr, perf_event, bpf_map, user_namespace, capability, kiocb, iov_iter, cred, const_buf, load_info, module, syscall64, kernel_cap_t, cap_inheritable, cap_permitted, cap_effective, linux_binprm, data_loc, net_device, bpf_cmd, dentry, bpf_prog Default: auto | true |
| btfType | string | Type to use as the initial resolve type. For kprobe args it looks up the named struct
from the kernel BTF, casting the argument's type before traversing the resolve path.
For UprobeSpecs and UsdtSpecs it looks up the type from the BTF file defined by BTFPath. | false |
| btfTypeModule | string | Kernel module that contains the BTFType. This is used only for kprobe args.
The module must already be loaded and expose BTF in /sys/kernel/btf. | false |
| label | string | Label to output in the JSON | false |
| maxData | boolean | Read maximum possible data (currently 327360). This field is only used
for char_buff data. When this value is false (default), the bpf program
will fetch at most 4096 bytes. In later kernels (>=5.4) tetragon
supports fetching up to 327360 bytes if this flag is turned on Default: false | false |
| resolve | string | Resolve the path to a specific attribute Default: | false |
| returnCopy | boolean | This field is used only for char_buf and char_iovec types. It indicates
that this argument should be read later (when the kretprobe for the
symbol is triggered) because it might not be populated when the kprobe
is triggered at the entrance of the function. For example, a buffer
supplied to read(2) won't have content until kretprobe is triggered. Default: false | false |
| sizeArgIndex | integer | Specifies the position of the corresponding size argument for this argument.
This field is used only for char_buf and char_iovec types. Format: int32 Minimum: 0 | false |
| source | string | Source of the data, if missing the default if function arguments | false |
KProbeSelector selects function calls for kprobe based on PIDs and function arguments. The results of MatchPIDs and MatchArgs are ANDed.
| Name | Type | Description | Required |
|---|---|---|---|
| label | string | Human-readable selector label used in status and metrics. | false |
| macros | []string | A list of macros names, defined in spec.selectorsMacros.
Filters specified in macros will be appended to corresponding filters of the selector. | false |
| matchActions | []object | A list of actions to execute when this selector matches | false |
| matchArgs | []object | A list of argument filters. MatchArgs are ANDed. | false |
| matchBinaries | []object | A list of binary exec name filters. | false |
| matchCapabilities | []object | A list of capabilities and IDs | false |
| matchCapabilityChanges | []object | IDs for capabilities changes | false |
| matchData | []object | A list of argument filters. MatchData are ANDed. | false |
| matchNamespaceChanges | []object | IDs for namespace changes | false |
| matchNamespaces | []object | A list of namespaces and IDs | false |
| matchPIDs | []object | A list of process ID filters. MatchPIDs are ANDed. | false |
| matchParentBinaries | []object | A list of process parent exec name filters. | false |
| matchReturnActions | []object | A list of actions to execute when MatchReturnArgs selector matches | false |
| matchReturnArgs | []object | A list of argument filters. MatchReturnArgs are ANDed. | false |
| matchWorkloads | object | Workloads to match | false |
| Name | Type | Description | Required |
|---|---|---|---|
| action | enum | Action to execute.
The Override action has three variants, depending on what arguments are set
1. Override the return value of function
Supported hooks: kprobes, uprobes, lsm
Arguments: ArgError (return value)
2. Override the value of a register
Supported hooks: uprobes
Arguments: ArgRegs
3. Override a function call
Supported hooks: uprobes
Arguments: One of:
- ArgNewSymbol: override call to a new symbol (in the binary)
- ArgNewAddr: override call to a new address (in the binary)
- ArgNewOffset: override call to an offset (in the binary) Enum: Post, Sigkill, Override, GetUrl, DnsLookup, NoPost, Signal, TrackSock, UntrackSock, NotifyEnforcer, CleanupEnforcerNotification, Set | true |
| argError | integer | error value for override action Format: int32 | false |
| argFqdn | string | A FQDN to lookup for the dnsLookup action | false |
| argIndex | integer | An arg index for the set action Format: int32 | false |
| argNewAddr | integer | An arg value for the override action, uprobe only.
The new symbol's address.
Beware that the symbol MUST be binary compatible with the traced uprobe symbol. Format: int64 | false |
| argNewOffset | integer | An arg value for the override action, uprobe only.
The new symbol's offset.
Beware that the symbol MUST be binary compatible with the traced uprobe symbol. Format: int64 | false |
| argNewSymbol | string | An arg value for the override action, uprobe only.
The new symbol name.
Beware that the symbol MUST be binary compatible with the traced uprobe symbol. | false |
| argRegs | []string | An arg value for the override action, uprobe only. | false |
| argSig | integer | A signal number for signal action Format: int32 | false |
| argSock | integer | An arg index for the sock for trackSock and untrackSock actions Format: int32 | false |
| argUrl | string | A URL for the getUrl action | false |
| argValue | integer | An arg value for the set action Format: int32 | false |
| imaHash | boolean | Enable collection of file hashes from integrity subsystem.
Only valid with the post action. | false |
| kernelStackTrace | boolean | Enable kernel stack trace export. Only valid with the post action. | false |
| rateLimit | string | A time period within which repeated messages will not be posted. Can be
specified in seconds (default or with 's' suffix), minutes ('m' suffix)
or hours ('h' suffix). Only valid with the post action. | false |
| rateLimitScope | string | The scope of the provided rate limit argument. Can be "thread" (default),
"process" (all threads for the same process), or "global". If "thread" is
selected then rate limiting applies per thread; if "process" is selected
then rate limiting applies per process; if "global" is selected then rate
limiting applies regardless of which process or thread caused the action.
Only valid with the post action and with a rateLimit specified. | false |
| userStackTrace | boolean | Enable user stack trace export. Only valid with the post action. | false |
| Name | Type | Description | Required |
|---|---|---|---|
| operator | enum | Filter operation. Enum: Equal, NotEqual, Prefix, NotPrefix, Postfix, NotPostfix, GreaterThan, LessThan, GT, LT, Mask, SPort, NotSPort, SPortPriv, NotSportPriv, DPort, NotDPort, DPortPriv, NotDPortPriv, SAddr, NotSAddr, DAddr, NotDAddr, Protocol, Family, State, InMap, NotInMap, CapabilitiesGained, InRange, NotInRange, SubString, SubStringIgnCase, CelExpr, FileType, NotFileType | true |
| args | []integer | Position of the operator arguments (in spec file) to apply the filter to. | false |
| index | integer | Position of the argument (in function prototype) to apply the filter to. Format: int32 Minimum: 0 | false |
| values | []string | Value to compare the argument against. | false |
| Name | Type | Description | Required |
|---|---|---|---|
| operator | enum | Filter operation. Enum: In, NotIn, Prefix, NotPrefix, Postfix, NotPostfix | true |
| values | []string | Value to compare the argument against. | true |
| followChildren | boolean | In addition to binaries, match children processes of specified binaries. Default: false | false |
| Name | Type | Description | Required |
|---|---|---|---|
| operator | enum | Namespace selector operator. Enum: In, NotIn | true |
| values | []string | Capabilities to match. | true |
| isNamespaceCapability | boolean | Indicates whether these caps are namespace caps. Default: false | false |
| type | enum | Type of capabilities Enum: Effective, Inheritable, Permitted Default: Effective | false |
| Name | Type | Description | Required |
|---|---|---|---|
| operator | enum | Namespace selector operator. Enum: In, NotIn | true |
| values | []string | Capabilities to match. | true |
| isNamespaceCapability | boolean | Indicates whether these caps are namespace caps. Default: false | false |
| type | enum | Type of capabilities Enum: Effective, Inheritable, Permitted Default: Effective | false |
| Name | Type | Description | Required |
|---|---|---|---|
| operator | enum | Filter operation. Enum: Equal, NotEqual, Prefix, NotPrefix, Postfix, NotPostfix, GreaterThan, LessThan, GT, LT, Mask, SPort, NotSPort, SPortPriv, NotSportPriv, DPort, NotDPort, DPortPriv, NotDPortPriv, SAddr, NotSAddr, DAddr, NotDAddr, Protocol, Family, State, InMap, NotInMap, CapabilitiesGained, InRange, NotInRange, SubString, SubStringIgnCase, CelExpr, FileType, NotFileType | true |
| args | []integer | Position of the operator arguments (in spec file) to apply the filter to. | false |
| index | integer | Position of the argument (in function prototype) to apply the filter to. Format: int32 Minimum: 0 | false |
| values | []string | Value to compare the argument against. | false |
| Name | Type | Description | Required |
|---|---|---|---|
| operator | enum | Namespace selector operator. Enum: In, NotIn | true |
| values | []string | Namespace types (e.g., Mnt, Pid) to match. | true |
| Name | Type | Description | Required |
|---|---|---|---|
| namespace | enum | Namespace selector name. Enum: Uts, Ipc, Mnt, Pid, PidForChildren, Net, Time, TimeForChildren, Cgroup, User | true |
| operator | enum | Namespace selector operator. Enum: In, NotIn | true |
| values | []string | Namespace IDs (or host_ns for host namespace) of namespaces to match. | true |
| Name | Type | Description | Required |
|---|---|---|---|
| operator | enum | PID selector operator. Enum: In, NotIn | true |
| values | []integer | Process IDs to match. | true |
| followForks | boolean | Matches any descendant processes of the matching PIDs. Default: false | false |
| isNamespacePID | boolean | Indicates whether PIDs are namespace PIDs. Default: false | false |
| Name | Type | Description | Required |
|---|---|---|---|
| operator | enum | Filter operation. Enum: In, NotIn, Prefix, NotPrefix, Postfix, NotPostfix | true |
| values | []string | Value to compare the argument against. | true |
| followChildren | boolean | In addition to binaries, match children processes of specified binaries. Default: false | false |
| Name | Type | Description | Required |
|---|---|---|---|
| action | enum | Action to execute.
The Override action has three variants, depending on what arguments are set
1. Override the return value of function
Supported hooks: kprobes, uprobes, lsm
Arguments: ArgError (return value)
2. Override the value of a register
Supported hooks: uprobes
Arguments: ArgRegs
3. Override a function call
Supported hooks: uprobes
Arguments: One of:
- ArgNewSymbol: override call to a new symbol (in the binary)
- ArgNewAddr: override call to a new address (in the binary)
- ArgNewOffset: override call to an offset (in the binary) Enum: Post, Sigkill, Override, GetUrl, DnsLookup, NoPost, Signal, TrackSock, UntrackSock, NotifyEnforcer, CleanupEnforcerNotification, Set | true |
| argError | integer | error value for override action Format: int32 | false |
| argFqdn | string | A FQDN to lookup for the dnsLookup action | false |
| argIndex | integer | An arg index for the set action Format: int32 | false |
| argNewAddr | integer | An arg value for the override action, uprobe only.
The new symbol's address.
Beware that the symbol MUST be binary compatible with the traced uprobe symbol. Format: int64 | false |
| argNewOffset | integer | An arg value for the override action, uprobe only.
The new symbol's offset.
Beware that the symbol MUST be binary compatible with the traced uprobe symbol. Format: int64 | false |
| argNewSymbol | string | An arg value for the override action, uprobe only.
The new symbol name.
Beware that the symbol MUST be binary compatible with the traced uprobe symbol. | false |
| argRegs | []string | An arg value for the override action, uprobe only. | false |
| argSig | integer | A signal number for signal action Format: int32 | false |
| argSock | integer | An arg index for the sock for trackSock and untrackSock actions Format: int32 | false |
| argUrl | string | A URL for the getUrl action | false |
| argValue | integer | An arg value for the set action Format: int32 | false |
| imaHash | boolean | Enable collection of file hashes from integrity subsystem.
Only valid with the post action. | false |
| kernelStackTrace | boolean | Enable kernel stack trace export. Only valid with the post action. | false |
| rateLimit | string | A time period within which repeated messages will not be posted. Can be
specified in seconds (default or with 's' suffix), minutes ('m' suffix)
or hours ('h' suffix). Only valid with the post action. | false |
| rateLimitScope | string | The scope of the provided rate limit argument. Can be "thread" (default),
"process" (all threads for the same process), or "global". If "thread" is
selected then rate limiting applies per thread; if "process" is selected
then rate limiting applies per process; if "global" is selected then rate
limiting applies regardless of which process or thread caused the action.
Only valid with the post action and with a rateLimit specified. | false |
| userStackTrace | boolean | Enable user stack trace export. Only valid with the post action. | false |
| Name | Type | Description | Required |
|---|---|---|---|
| operator | enum | Filter operation. Enum: Equal, NotEqual, Prefix, NotPrefix, Postfix, NotPostfix, GreaterThan, LessThan, GT, LT, Mask, SPort, NotSPort, SPortPriv, NotSportPriv, DPort, NotDPort, DPortPriv, NotDPortPriv, SAddr, NotSAddr, DAddr, NotDAddr, Protocol, Family, State, InMap, NotInMap, CapabilitiesGained, InRange, NotInRange, SubString, SubStringIgnCase, CelExpr, FileType, NotFileType | true |
| args | []integer | Position of the operator arguments (in spec file) to apply the filter to. | false |
| index | integer | Position of the argument (in function prototype) to apply the filter to. Format: int32 Minimum: 0 | false |
| values | []string | Value to compare the argument against. | false |
Workloads to match
| Name | Type | Description | Required |
|---|---|---|---|
| containerSelector | object | ContainerSelector selects containers that this policy applies to.
A map of container fields will be constructed in the same way as a map of labels.
The name of the field represents the label "key", and the value of the field - label "value".
Currently, only the "name" field is supported. | false |
| hostSelector | object | HostSelector selects hosts that this policy applies to.
For now only ~ (none) and {} (all) is supported. Validations: | false |
| podSelector | object | PodSelector selects pods that this policy applies to | false |
ContainerSelector selects containers that this policy applies to. A map of container fields will be constructed in the same way as a map of labels. The name of the field represents the label “key”, and the value of the field - label “value”. Currently, only the “name” field is supported.
| Name | Type | Description | Required |
|---|---|---|---|
| matchExpressions | []object | matchExpressions is a list of label selector requirements. The requirements are ANDed. | false |
| matchLabels | map[string]string | matchLabels is a map of {key,value} pairs. A single {key,value} in the matchLabels
map is equivalent to an element of matchExpressions, whose key field is "key", the
operator is "In", and the values array contains only "value". The requirements are ANDed. | false |
A label selector requirement is a selector that contains values, a key, and an operator that relates the key and values.
| Name | Type | Description | Required |
|---|---|---|---|
| key | string | key is the label key that the selector applies to. | true |
| operator | enum | operator represents a key's relationship to a set of values.
Valid operators are In, NotIn, Exists and DoesNotExist. Enum: In, NotIn, Exists, DoesNotExist | true |
| values | []string | values is an array of string values. If the operator is In or NotIn,
the values array must be non-empty. If the operator is Exists or DoesNotExist,
the values array must be empty. This array is replaced during a strategic
merge patch. | false |
HostSelector selects hosts that this policy applies to. For now only ~ (none) and {} (all) is supported.
| Name | Type | Description | Required |
|---|---|---|---|
| matchExpressions | []object | matchExpressions is a list of label selector requirements. The requirements are ANDed. | false |
| matchLabels | map[string]string | matchLabels is a map of {key,value} pairs. A single {key,value} in the matchLabels
map is equivalent to an element of matchExpressions, whose key field is "key", the
operator is "In", and the values array contains only "value". The requirements are ANDed. | false |
A label selector requirement is a selector that contains values, a key, and an operator that relates the key and values.
| Name | Type | Description | Required |
|---|---|---|---|
| key | string | key is the label key that the selector applies to. | true |
| operator | enum | operator represents a key's relationship to a set of values.
Valid operators are In, NotIn, Exists and DoesNotExist. Enum: In, NotIn, Exists, DoesNotExist | true |
| values | []string | values is an array of string values. If the operator is In or NotIn,
the values array must be non-empty. If the operator is Exists or DoesNotExist,
the values array must be empty. This array is replaced during a strategic
merge patch. | false |
PodSelector selects pods that this policy applies to
| Name | Type | Description | Required |
|---|---|---|---|
| matchExpressions | []object | matchExpressions is a list of label selector requirements. The requirements are ANDed. | false |
| matchLabels | map[string]string | matchLabels is a map of {key,value} pairs. A single {key,value} in the matchLabels
map is equivalent to an element of matchExpressions, whose key field is "key", the
operator is "In", and the values array contains only "value". The requirements are ANDed. | false |
A label selector requirement is a selector that contains values, a key, and an operator that relates the key and values.
| Name | Type | Description | Required |
|---|---|---|---|
| key | string | key is the label key that the selector applies to. | true |
| operator | enum | operator represents a key's relationship to a set of values.
Valid operators are In, NotIn, Exists and DoesNotExist. Enum: In, NotIn, Exists, DoesNotExist | true |
| values | []string | values is an array of string values. If the operator is In or NotIn,
the values array must be non-empty. If the operator is Exists or DoesNotExist,
the values array must be empty. This array is replaced during a strategic
merge patch. | false |
| Name | Type | Description | Required |
|---|---|---|---|
| name | string | Usdt name | true |
| path | string | Name of the traced binary | true |
| provider | string | Usdt provider name | true |
| args | []object | A list of function arguments to include in the trace output. | false |
| btfPath | string | path for a BTF file for the traced binary | false |
| message | string | A short message of 256 characters max that will be included
in the event output to inform users what is going on. | false |
| selectors | []object | Selectors to apply before producing trace output. Selectors are ORed. | false |
| tags | []string | Tags to categorize the event, will be include in the event output.
Maximum of 16 Tags are supported. | false |
| Name | Type | Description | Required |
|---|---|---|---|
| index | integer | Position of the argument. Format: int32 Minimum: 0 | true |
| type | enum | Argument type. Enum: auto, int, sint8, int8, uint8, sint16, int16, uint16, uint32, sint32, int32, ulong, uint64, size_t, long, sint64, int64, char_buf, char_iovec, skb, sock, sockaddr, socket, sockaddr_un, string, fd, file, filename, path, nop, bpf_attr, perf_event, bpf_map, user_namespace, capability, kiocb, iov_iter, cred, const_buf, load_info, module, syscall64, kernel_cap_t, cap_inheritable, cap_permitted, cap_effective, linux_binprm, data_loc, net_device, bpf_cmd, dentry, bpf_prog Default: auto | true |
| btfType | string | Type to use as the initial resolve type. For kprobe args it looks up the named struct
from the kernel BTF, casting the argument's type before traversing the resolve path.
For UprobeSpecs and UsdtSpecs it looks up the type from the BTF file defined by BTFPath. | false |
| btfTypeModule | string | Kernel module that contains the BTFType. This is used only for kprobe args.
The module must already be loaded and expose BTF in /sys/kernel/btf. | false |
| label | string | Label to output in the JSON | false |
| maxData | boolean | Read maximum possible data (currently 327360). This field is only used
for char_buff data. When this value is false (default), the bpf program
will fetch at most 4096 bytes. In later kernels (>=5.4) tetragon
supports fetching up to 327360 bytes if this flag is turned on Default: false | false |
| resolve | string | Resolve the path to a specific attribute Default: | false |
| returnCopy | boolean | This field is used only for char_buf and char_iovec types. It indicates
that this argument should be read later (when the kretprobe for the
symbol is triggered) because it might not be populated when the kprobe
is triggered at the entrance of the function. For example, a buffer
supplied to read(2) won't have content until kretprobe is triggered. Default: false | false |
| sizeArgIndex | integer | Specifies the position of the corresponding size argument for this argument.
This field is used only for char_buf and char_iovec types. Format: int32 Minimum: 0 | false |
| source | string | Source of the data, if missing the default if function arguments | false |
KProbeSelector selects function calls for kprobe based on PIDs and function arguments. The results of MatchPIDs and MatchArgs are ANDed.
| Name | Type | Description | Required |
|---|---|---|---|
| label | string | Human-readable selector label used in status and metrics. | false |
| macros | []string | A list of macros names, defined in spec.selectorsMacros.
Filters specified in macros will be appended to corresponding filters of the selector. | false |
| matchActions | []object | A list of actions to execute when this selector matches | false |
| matchArgs | []object | A list of argument filters. MatchArgs are ANDed. | false |
| matchBinaries | []object | A list of binary exec name filters. | false |
| matchCapabilities | []object | A list of capabilities and IDs | false |
| matchCapabilityChanges | []object | IDs for capabilities changes | false |
| matchData | []object | A list of argument filters. MatchData are ANDed. | false |
| matchNamespaceChanges | []object | IDs for namespace changes | false |
| matchNamespaces | []object | A list of namespaces and IDs | false |
| matchPIDs | []object | A list of process ID filters. MatchPIDs are ANDed. | false |
| matchParentBinaries | []object | A list of process parent exec name filters. | false |
| matchReturnActions | []object | A list of actions to execute when MatchReturnArgs selector matches | false |
| matchReturnArgs | []object | A list of argument filters. MatchReturnArgs are ANDed. | false |
| matchWorkloads | object | Workloads to match | false |
| Name | Type | Description | Required |
|---|---|---|---|
| action | enum | Action to execute.
The Override action has three variants, depending on what arguments are set
1. Override the return value of function
Supported hooks: kprobes, uprobes, lsm
Arguments: ArgError (return value)
2. Override the value of a register
Supported hooks: uprobes
Arguments: ArgRegs
3. Override a function call
Supported hooks: uprobes
Arguments: One of:
- ArgNewSymbol: override call to a new symbol (in the binary)
- ArgNewAddr: override call to a new address (in the binary)
- ArgNewOffset: override call to an offset (in the binary) Enum: Post, Sigkill, Override, GetUrl, DnsLookup, NoPost, Signal, TrackSock, UntrackSock, NotifyEnforcer, CleanupEnforcerNotification, Set | true |
| argError | integer | error value for override action Format: int32 | false |
| argFqdn | string | A FQDN to lookup for the dnsLookup action | false |
| argIndex | integer | An arg index for the set action Format: int32 | false |
| argNewAddr | integer | An arg value for the override action, uprobe only.
The new symbol's address.
Beware that the symbol MUST be binary compatible with the traced uprobe symbol. Format: int64 | false |
| argNewOffset | integer | An arg value for the override action, uprobe only.
The new symbol's offset.
Beware that the symbol MUST be binary compatible with the traced uprobe symbol. Format: int64 | false |
| argNewSymbol | string | An arg value for the override action, uprobe only.
The new symbol name.
Beware that the symbol MUST be binary compatible with the traced uprobe symbol. | false |
| argRegs | []string | An arg value for the override action, uprobe only. | false |
| argSig | integer | A signal number for signal action Format: int32 | false |
| argSock | integer | An arg index for the sock for trackSock and untrackSock actions Format: int32 | false |
| argUrl | string | A URL for the getUrl action | false |
| argValue | integer | An arg value for the set action Format: int32 | false |
| imaHash | boolean | Enable collection of file hashes from integrity subsystem.
Only valid with the post action. | false |
| kernelStackTrace | boolean | Enable kernel stack trace export. Only valid with the post action. | false |
| rateLimit | string | A time period within which repeated messages will not be posted. Can be
specified in seconds (default or with 's' suffix), minutes ('m' suffix)
or hours ('h' suffix). Only valid with the post action. | false |
| rateLimitScope | string | The scope of the provided rate limit argument. Can be "thread" (default),
"process" (all threads for the same process), or "global". If "thread" is
selected then rate limiting applies per thread; if "process" is selected
then rate limiting applies per process; if "global" is selected then rate
limiting applies regardless of which process or thread caused the action.
Only valid with the post action and with a rateLimit specified. | false |
| userStackTrace | boolean | Enable user stack trace export. Only valid with the post action. | false |
| Name | Type | Description | Required |
|---|---|---|---|
| operator | enum | Filter operation. Enum: Equal, NotEqual, Prefix, NotPrefix, Postfix, NotPostfix, GreaterThan, LessThan, GT, LT, Mask, SPort, NotSPort, SPortPriv, NotSportPriv, DPort, NotDPort, DPortPriv, NotDPortPriv, SAddr, NotSAddr, DAddr, NotDAddr, Protocol, Family, State, InMap, NotInMap, CapabilitiesGained, InRange, NotInRange, SubString, SubStringIgnCase, CelExpr, FileType, NotFileType | true |
| args | []integer | Position of the operator arguments (in spec file) to apply the filter to. | false |
| index | integer | Position of the argument (in function prototype) to apply the filter to. Format: int32 Minimum: 0 | false |
| values | []string | Value to compare the argument against. | false |
| Name | Type | Description | Required |
|---|---|---|---|
| operator | enum | Filter operation. Enum: In, NotIn, Prefix, NotPrefix, Postfix, NotPostfix | true |
| values | []string | Value to compare the argument against. | true |
| followChildren | boolean | In addition to binaries, match children processes of specified binaries. Default: false | false |
| Name | Type | Description | Required |
|---|---|---|---|
| operator | enum | Namespace selector operator. Enum: In, NotIn | true |
| values | []string | Capabilities to match. | true |
| isNamespaceCapability | boolean | Indicates whether these caps are namespace caps. Default: false | false |
| type | enum | Type of capabilities Enum: Effective, Inheritable, Permitted Default: Effective | false |
| Name | Type | Description | Required |
|---|---|---|---|
| operator | enum | Namespace selector operator. Enum: In, NotIn | true |
| values | []string | Capabilities to match. | true |
| isNamespaceCapability | boolean | Indicates whether these caps are namespace caps. Default: false | false |
| type | enum | Type of capabilities Enum: Effective, Inheritable, Permitted Default: Effective | false |
| Name | Type | Description | Required |
|---|---|---|---|
| operator | enum | Filter operation. Enum: Equal, NotEqual, Prefix, NotPrefix, Postfix, NotPostfix, GreaterThan, LessThan, GT, LT, Mask, SPort, NotSPort, SPortPriv, NotSportPriv, DPort, NotDPort, DPortPriv, NotDPortPriv, SAddr, NotSAddr, DAddr, NotDAddr, Protocol, Family, State, InMap, NotInMap, CapabilitiesGained, InRange, NotInRange, SubString, SubStringIgnCase, CelExpr, FileType, NotFileType | true |
| args | []integer | Position of the operator arguments (in spec file) to apply the filter to. | false |
| index | integer | Position of the argument (in function prototype) to apply the filter to. Format: int32 Minimum: 0 | false |
| values | []string | Value to compare the argument against. | false |
| Name | Type | Description | Required |
|---|---|---|---|
| operator | enum | Namespace selector operator. Enum: In, NotIn | true |
| values | []string | Namespace types (e.g., Mnt, Pid) to match. | true |
| Name | Type | Description | Required |
|---|---|---|---|
| namespace | enum | Namespace selector name. Enum: Uts, Ipc, Mnt, Pid, PidForChildren, Net, Time, TimeForChildren, Cgroup, User | true |
| operator | enum | Namespace selector operator. Enum: In, NotIn | true |
| values | []string | Namespace IDs (or host_ns for host namespace) of namespaces to match. | true |
| Name | Type | Description | Required |
|---|---|---|---|
| operator | enum | PID selector operator. Enum: In, NotIn | true |
| values | []integer | Process IDs to match. | true |
| followForks | boolean | Matches any descendant processes of the matching PIDs. Default: false | false |
| isNamespacePID | boolean | Indicates whether PIDs are namespace PIDs. Default: false | false |
| Name | Type | Description | Required |
|---|---|---|---|
| operator | enum | Filter operation. Enum: In, NotIn, Prefix, NotPrefix, Postfix, NotPostfix | true |
| values | []string | Value to compare the argument against. | true |
| followChildren | boolean | In addition to binaries, match children processes of specified binaries. Default: false | false |
| Name | Type | Description | Required |
|---|---|---|---|
| action | enum | Action to execute.
The Override action has three variants, depending on what arguments are set
1. Override the return value of function
Supported hooks: kprobes, uprobes, lsm
Arguments: ArgError (return value)
2. Override the value of a register
Supported hooks: uprobes
Arguments: ArgRegs
3. Override a function call
Supported hooks: uprobes
Arguments: One of:
- ArgNewSymbol: override call to a new symbol (in the binary)
- ArgNewAddr: override call to a new address (in the binary)
- ArgNewOffset: override call to an offset (in the binary) Enum: Post, Sigkill, Override, GetUrl, DnsLookup, NoPost, Signal, TrackSock, UntrackSock, NotifyEnforcer, CleanupEnforcerNotification, Set | true |
| argError | integer | error value for override action Format: int32 | false |
| argFqdn | string | A FQDN to lookup for the dnsLookup action | false |
| argIndex | integer | An arg index for the set action Format: int32 | false |
| argNewAddr | integer | An arg value for the override action, uprobe only.
The new symbol's address.
Beware that the symbol MUST be binary compatible with the traced uprobe symbol. Format: int64 | false |
| argNewOffset | integer | An arg value for the override action, uprobe only.
The new symbol's offset.
Beware that the symbol MUST be binary compatible with the traced uprobe symbol. Format: int64 | false |
| argNewSymbol | string | An arg value for the override action, uprobe only.
The new symbol name.
Beware that the symbol MUST be binary compatible with the traced uprobe symbol. | false |
| argRegs | []string | An arg value for the override action, uprobe only. | false |
| argSig | integer | A signal number for signal action Format: int32 | false |
| argSock | integer | An arg index for the sock for trackSock and untrackSock actions Format: int32 | false |
| argUrl | string | A URL for the getUrl action | false |
| argValue | integer | An arg value for the set action Format: int32 | false |
| imaHash | boolean | Enable collection of file hashes from integrity subsystem.
Only valid with the post action. | false |
| kernelStackTrace | boolean | Enable kernel stack trace export. Only valid with the post action. | false |
| rateLimit | string | A time period within which repeated messages will not be posted. Can be
specified in seconds (default or with 's' suffix), minutes ('m' suffix)
or hours ('h' suffix). Only valid with the post action. | false |
| rateLimitScope | string | The scope of the provided rate limit argument. Can be "thread" (default),
"process" (all threads for the same process), or "global". If "thread" is
selected then rate limiting applies per thread; if "process" is selected
then rate limiting applies per process; if "global" is selected then rate
limiting applies regardless of which process or thread caused the action.
Only valid with the post action and with a rateLimit specified. | false |
| userStackTrace | boolean | Enable user stack trace export. Only valid with the post action. | false |
| Name | Type | Description | Required |
|---|---|---|---|
| operator | enum | Filter operation. Enum: Equal, NotEqual, Prefix, NotPrefix, Postfix, NotPostfix, GreaterThan, LessThan, GT, LT, Mask, SPort, NotSPort, SPortPriv, NotSportPriv, DPort, NotDPort, DPortPriv, NotDPortPriv, SAddr, NotSAddr, DAddr, NotDAddr, Protocol, Family, State, InMap, NotInMap, CapabilitiesGained, InRange, NotInRange, SubString, SubStringIgnCase, CelExpr, FileType, NotFileType | true |
| args | []integer | Position of the operator arguments (in spec file) to apply the filter to. | false |
| index | integer | Position of the argument (in function prototype) to apply the filter to. Format: int32 Minimum: 0 | false |
| values | []string | Value to compare the argument against. | false |
Workloads to match
| Name | Type | Description | Required |
|---|---|---|---|
| containerSelector | object | ContainerSelector selects containers that this policy applies to.
A map of container fields will be constructed in the same way as a map of labels.
The name of the field represents the label "key", and the value of the field - label "value".
Currently, only the "name" field is supported. | false |
| hostSelector | object | HostSelector selects hosts that this policy applies to.
For now only ~ (none) and {} (all) is supported. Validations: | false |
| podSelector | object | PodSelector selects pods that this policy applies to | false |
ContainerSelector selects containers that this policy applies to. A map of container fields will be constructed in the same way as a map of labels. The name of the field represents the label “key”, and the value of the field - label “value”. Currently, only the “name” field is supported.
| Name | Type | Description | Required |
|---|---|---|---|
| matchExpressions | []object | matchExpressions is a list of label selector requirements. The requirements are ANDed. | false |
| matchLabels | map[string]string | matchLabels is a map of {key,value} pairs. A single {key,value} in the matchLabels
map is equivalent to an element of matchExpressions, whose key field is "key", the
operator is "In", and the values array contains only "value". The requirements are ANDed. | false |
A label selector requirement is a selector that contains values, a key, and an operator that relates the key and values.
| Name | Type | Description | Required |
|---|---|---|---|
| key | string | key is the label key that the selector applies to. | true |
| operator | enum | operator represents a key's relationship to a set of values.
Valid operators are In, NotIn, Exists and DoesNotExist. Enum: In, NotIn, Exists, DoesNotExist | true |
| values | []string | values is an array of string values. If the operator is In or NotIn,
the values array must be non-empty. If the operator is Exists or DoesNotExist,
the values array must be empty. This array is replaced during a strategic
merge patch. | false |
HostSelector selects hosts that this policy applies to. For now only ~ (none) and {} (all) is supported.
| Name | Type | Description | Required |
|---|---|---|---|
| matchExpressions | []object | matchExpressions is a list of label selector requirements. The requirements are ANDed. | false |
| matchLabels | map[string]string | matchLabels is a map of {key,value} pairs. A single {key,value} in the matchLabels
map is equivalent to an element of matchExpressions, whose key field is "key", the
operator is "In", and the values array contains only "value". The requirements are ANDed. | false |
A label selector requirement is a selector that contains values, a key, and an operator that relates the key and values.
| Name | Type | Description | Required |
|---|---|---|---|
| key | string | key is the label key that the selector applies to. | true |
| operator | enum | operator represents a key's relationship to a set of values.
Valid operators are In, NotIn, Exists and DoesNotExist. Enum: In, NotIn, Exists, DoesNotExist | true |
| values | []string | values is an array of string values. If the operator is In or NotIn,
the values array must be non-empty. If the operator is Exists or DoesNotExist,
the values array must be empty. This array is replaced during a strategic
merge patch. | false |
PodSelector selects pods that this policy applies to
| Name | Type | Description | Required |
|---|---|---|---|
| matchExpressions | []object | matchExpressions is a list of label selector requirements. The requirements are ANDed. | false |
| matchLabels | map[string]string | matchLabels is a map of {key,value} pairs. A single {key,value} in the matchLabels
map is equivalent to an element of matchExpressions, whose key field is "key", the
operator is "In", and the values array contains only "value". The requirements are ANDed. | false |
A label selector requirement is a selector that contains values, a key, and an operator that relates the key and values.
| Name | Type | Description | Required |
|---|---|---|---|
| key | string | key is the label key that the selector applies to. | true |
| operator | enum | operator represents a key's relationship to a set of values.
Valid operators are In, NotIn, Exists and DoesNotExist. Enum: In, NotIn, Exists, DoesNotExist | true |
| values | []string | values is an array of string values. If the operator is In or NotIn,
the values array must be non-empty. If the operator is Exists or DoesNotExist,
the values array must be empty. This array is replaced during a strategic
merge patch. | false |
| Name | Type | Description | Required |
|---|---|---|---|
| apiVersion | string | cilium.io/v1alpha1 | true |
| kind | string | TracingPolicyNamespaced | true |
| metadata | object | Refer to the Kubernetes API documentation for the fields of the `metadata` field. | true |
| spec | object | Tracing policy specification. | true |
Tracing policy specification.
| Name | Type | Description | Required |
|---|---|---|---|
| containerSelector | object | ContainerSelector selects containers that this policy applies to.
A map of container fields will be constructed in the same way as a map of labels.
The name of the field represents the label "key", and the value of the field - label "value".
Currently, only the "name" field is supported. | false |
| enforcers | []object | A enforcer spec. | false |
| fentries | []object | A list of fentry specs. | false |
| hostSelector | object | HostSelector selects hosts that this policy applies to.
For now only ~ (none) and {} (all) is supported. Validations: | false |
| kprobes | []object | A list of kprobe specs. | false |
| lists | []object | A list of list specs. | false |
| loader | boolean | Enable loader events | false |
| lsmhooks | []object | A list of uprobe specs. | false |
| nodeSelector | object | NodeSelector selects the nodes, by label, on which Tetragon agents load
this policy. If empty or unset, the policy is loaded on all nodes. This differs in
purpose from hostSelector: nodeSelector controls where a policy is loaded
(on which nodes), whereas hostSelector controls which workloads a loaded
policy applies to (host vs pod workloads) and does not affect whether the
policy is loaded on a node. Use nodeSelector to target a node group such
as GPU nodes, a specific architecture or OS, or a canary pool; use
hostSelector to scope a loaded policy to host workloads. Unlike
hostSelector, nodeSelector supports arbitrary matchLabels and
matchExpressions. | false |
| options | []object | A list of overloaded options | false |
| podSelector | object | PodSelector selects pods that this policy applies to | false |
| selectorsMacros | map[string]object | SelectorsMacros is used to define selectors macros, which can be used
in probes/hooks selectors by their names. | false |
| tracepoints | []object | A list of tracepoint specs. | false |
| uprobes | []object | A list of uprobe specs. | false |
| usdts | []object | A list of usdt specs. | false |
ContainerSelector selects containers that this policy applies to. A map of container fields will be constructed in the same way as a map of labels. The name of the field represents the label “key”, and the value of the field - label “value”. Currently, only the “name” field is supported.
| Name | Type | Description | Required |
|---|---|---|---|
| matchExpressions | []object | matchExpressions is a list of label selector requirements. The requirements are ANDed. | false |
| matchLabels | map[string]string | matchLabels is a map of {key,value} pairs. A single {key,value} in the matchLabels
map is equivalent to an element of matchExpressions, whose key field is "key", the
operator is "In", and the values array contains only "value". The requirements are ANDed. | false |
A label selector requirement is a selector that contains values, a key, and an operator that relates the key and values.
| Name | Type | Description | Required |
|---|---|---|---|
| key | string | key is the label key that the selector applies to. | true |
| operator | enum | operator represents a key's relationship to a set of values.
Valid operators are In, NotIn, Exists and DoesNotExist. Enum: In, NotIn, Exists, DoesNotExist | true |
| values | []string | values is an array of string values. If the operator is In or NotIn,
the values array must be non-empty. If the operator is Exists or DoesNotExist,
the values array must be empty. This array is replaced during a strategic
merge patch. | false |
| Name | Type | Description | Required |
|---|---|---|---|
| calls | []string | Calls where enforcer is executed in | true |
| Name | Type | Description | Required |
|---|---|---|---|
| call | string | Name of the function to apply the kprobe spec to. | true |
| args | []object | A list of function arguments to include in the trace output. | false |
| data | []object | A list of data to include in the trace output. | false |
| ignore | object | Conditions for ignoring this kprobe | false |
| message | string | A short message of 256 characters max that will be included
in the event output to inform users what is going on. | false |
| return | boolean | Indicates whether to collect return value of the traced function. Default: false | false |
| returnArg | object | A return argument to include in the trace output. | false |
| returnArgAction | string | An action to perform on the return value.
Use returnArg to include the return value in the event output.
Supported actions are: TrackSock;UntrackSock | false |
| selectors | []object | Selectors to apply before producing trace output. Selectors are ORed and short-circuited. | false |
| syscall | boolean | Indicates whether the traced function is a syscall. Default: true | false |
| tags | []string | Tags to categorize the event, will be include in the event output.
Maximum of 16 Tags are supported. | false |
| Name | Type | Description | Required |
|---|---|---|---|
| index | integer | Position of the argument. Format: int32 Minimum: 0 | true |
| type | enum | Argument type. Enum: auto, int, sint8, int8, uint8, sint16, int16, uint16, uint32, sint32, int32, ulong, uint64, size_t, long, sint64, int64, char_buf, char_iovec, skb, sock, sockaddr, socket, sockaddr_un, string, fd, file, filename, path, nop, bpf_attr, perf_event, bpf_map, user_namespace, capability, kiocb, iov_iter, cred, const_buf, load_info, module, syscall64, kernel_cap_t, cap_inheritable, cap_permitted, cap_effective, linux_binprm, data_loc, net_device, bpf_cmd, dentry, bpf_prog Default: auto | true |
| btfType | string | Type to use as the initial resolve type. For kprobe args it looks up the named struct
from the kernel BTF, casting the argument's type before traversing the resolve path.
For UprobeSpecs and UsdtSpecs it looks up the type from the BTF file defined by BTFPath. | false |
| btfTypeModule | string | Kernel module that contains the BTFType. This is used only for kprobe args.
The module must already be loaded and expose BTF in /sys/kernel/btf. | false |
| label | string | Label to output in the JSON | false |
| maxData | boolean | Read maximum possible data (currently 327360). This field is only used
for char_buff data. When this value is false (default), the bpf program
will fetch at most 4096 bytes. In later kernels (>=5.4) tetragon
supports fetching up to 327360 bytes if this flag is turned on Default: false | false |
| resolve | string | Resolve the path to a specific attribute Default: | false |
| returnCopy | boolean | This field is used only for char_buf and char_iovec types. It indicates
that this argument should be read later (when the kretprobe for the
symbol is triggered) because it might not be populated when the kprobe
is triggered at the entrance of the function. For example, a buffer
supplied to read(2) won't have content until kretprobe is triggered. Default: false | false |
| sizeArgIndex | integer | Specifies the position of the corresponding size argument for this argument.
This field is used only for char_buf and char_iovec types. Format: int32 Minimum: 0 | false |
| source | string | Source of the data, if missing the default if function arguments | false |
| Name | Type | Description | Required |
|---|---|---|---|
| index | integer | Position of the argument. Format: int32 Minimum: 0 | true |
| type | enum | Argument type. Enum: auto, int, sint8, int8, uint8, sint16, int16, uint16, uint32, sint32, int32, ulong, uint64, size_t, long, sint64, int64, char_buf, char_iovec, skb, sock, sockaddr, socket, sockaddr_un, string, fd, file, filename, path, nop, bpf_attr, perf_event, bpf_map, user_namespace, capability, kiocb, iov_iter, cred, const_buf, load_info, module, syscall64, kernel_cap_t, cap_inheritable, cap_permitted, cap_effective, linux_binprm, data_loc, net_device, bpf_cmd, dentry, bpf_prog Default: auto | true |
| btfType | string | Type to use as the initial resolve type. For kprobe args it looks up the named struct
from the kernel BTF, casting the argument's type before traversing the resolve path.
For UprobeSpecs and UsdtSpecs it looks up the type from the BTF file defined by BTFPath. | false |
| btfTypeModule | string | Kernel module that contains the BTFType. This is used only for kprobe args.
The module must already be loaded and expose BTF in /sys/kernel/btf. | false |
| label | string | Label to output in the JSON | false |
| maxData | boolean | Read maximum possible data (currently 327360). This field is only used
for char_buff data. When this value is false (default), the bpf program
will fetch at most 4096 bytes. In later kernels (>=5.4) tetragon
supports fetching up to 327360 bytes if this flag is turned on Default: false | false |
| resolve | string | Resolve the path to a specific attribute Default: | false |
| returnCopy | boolean | This field is used only for char_buf and char_iovec types. It indicates
that this argument should be read later (when the kretprobe for the
symbol is triggered) because it might not be populated when the kprobe
is triggered at the entrance of the function. For example, a buffer
supplied to read(2) won't have content until kretprobe is triggered. Default: false | false |
| sizeArgIndex | integer | Specifies the position of the corresponding size argument for this argument.
This field is used only for char_buf and char_iovec types. Format: int32 Minimum: 0 | false |
| source | string | Source of the data, if missing the default if function arguments | false |
Conditions for ignoring this kprobe
| Name | Type | Description | Required |
|---|---|---|---|
| callNotFound | boolean | Ignores calls that are not present in the system | false |
A return argument to include in the trace output.
| Name | Type | Description | Required |
|---|---|---|---|
| index | integer | Position of the argument. Format: int32 Minimum: 0 | true |
| type | enum | Argument type. Enum: auto, int, sint8, int8, uint8, sint16, int16, uint16, uint32, sint32, int32, ulong, uint64, size_t, long, sint64, int64, char_buf, char_iovec, skb, sock, sockaddr, socket, sockaddr_un, string, fd, file, filename, path, nop, bpf_attr, perf_event, bpf_map, user_namespace, capability, kiocb, iov_iter, cred, const_buf, load_info, module, syscall64, kernel_cap_t, cap_inheritable, cap_permitted, cap_effective, linux_binprm, data_loc, net_device, bpf_cmd, dentry, bpf_prog Default: auto | true |
| btfType | string | Type to use as the initial resolve type. For kprobe args it looks up the named struct
from the kernel BTF, casting the argument's type before traversing the resolve path.
For UprobeSpecs and UsdtSpecs it looks up the type from the BTF file defined by BTFPath. | false |
| btfTypeModule | string | Kernel module that contains the BTFType. This is used only for kprobe args.
The module must already be loaded and expose BTF in /sys/kernel/btf. | false |
| label | string | Label to output in the JSON | false |
| maxData | boolean | Read maximum possible data (currently 327360). This field is only used
for char_buff data. When this value is false (default), the bpf program
will fetch at most 4096 bytes. In later kernels (>=5.4) tetragon
supports fetching up to 327360 bytes if this flag is turned on Default: false | false |
| resolve | string | Resolve the path to a specific attribute Default: | false |
| returnCopy | boolean | This field is used only for char_buf and char_iovec types. It indicates
that this argument should be read later (when the kretprobe for the
symbol is triggered) because it might not be populated when the kprobe
is triggered at the entrance of the function. For example, a buffer
supplied to read(2) won't have content until kretprobe is triggered. Default: false | false |
| sizeArgIndex | integer | Specifies the position of the corresponding size argument for this argument.
This field is used only for char_buf and char_iovec types. Format: int32 Minimum: 0 | false |
| source | string | Source of the data, if missing the default if function arguments | false |
KProbeSelector selects function calls for kprobe based on PIDs and function arguments. The results of MatchPIDs and MatchArgs are ANDed.
| Name | Type | Description | Required |
|---|---|---|---|
| label | string | Human-readable selector label used in status and metrics. | false |
| macros | []string | A list of macros names, defined in spec.selectorsMacros.
Filters specified in macros will be appended to corresponding filters of the selector. | false |
| matchActions | []object | A list of actions to execute when this selector matches | false |
| matchArgs | []object | A list of argument filters. MatchArgs are ANDed. | false |
| matchBinaries | []object | A list of binary exec name filters. | false |
| matchCapabilities | []object | A list of capabilities and IDs | false |
| matchCapabilityChanges | []object | IDs for capabilities changes | false |
| matchData | []object | A list of argument filters. MatchData are ANDed. | false |
| matchNamespaceChanges | []object | IDs for namespace changes | false |
| matchNamespaces | []object | A list of namespaces and IDs | false |
| matchPIDs | []object | A list of process ID filters. MatchPIDs are ANDed. | false |
| matchParentBinaries | []object | A list of process parent exec name filters. | false |
| matchReturnActions | []object | A list of actions to execute when MatchReturnArgs selector matches | false |
| matchReturnArgs | []object | A list of argument filters. MatchReturnArgs are ANDed. | false |
| matchWorkloads | object | Workloads to match | false |
| Name | Type | Description | Required |
|---|---|---|---|
| action | enum | Action to execute.
The Override action has three variants, depending on what arguments are set
1. Override the return value of function
Supported hooks: kprobes, uprobes, lsm
Arguments: ArgError (return value)
2. Override the value of a register
Supported hooks: uprobes
Arguments: ArgRegs
3. Override a function call
Supported hooks: uprobes
Arguments: One of:
- ArgNewSymbol: override call to a new symbol (in the binary)
- ArgNewAddr: override call to a new address (in the binary)
- ArgNewOffset: override call to an offset (in the binary) Enum: Post, Sigkill, Override, GetUrl, DnsLookup, NoPost, Signal, TrackSock, UntrackSock, NotifyEnforcer, CleanupEnforcerNotification, Set | true |
| argError | integer | error value for override action Format: int32 | false |
| argFqdn | string | A FQDN to lookup for the dnsLookup action | false |
| argIndex | integer | An arg index for the set action Format: int32 | false |
| argNewAddr | integer | An arg value for the override action, uprobe only.
The new symbol's address.
Beware that the symbol MUST be binary compatible with the traced uprobe symbol. Format: int64 | false |
| argNewOffset | integer | An arg value for the override action, uprobe only.
The new symbol's offset.
Beware that the symbol MUST be binary compatible with the traced uprobe symbol. Format: int64 | false |
| argNewSymbol | string | An arg value for the override action, uprobe only.
The new symbol name.
Beware that the symbol MUST be binary compatible with the traced uprobe symbol. | false |
| argRegs | []string | An arg value for the override action, uprobe only. | false |
| argSig | integer | A signal number for signal action Format: int32 | false |
| argSock | integer | An arg index for the sock for trackSock and untrackSock actions Format: int32 | false |
| argUrl | string | A URL for the getUrl action | false |
| argValue | integer | An arg value for the set action Format: int32 | false |
| imaHash | boolean | Enable collection of file hashes from integrity subsystem.
Only valid with the post action. | false |
| kernelStackTrace | boolean | Enable kernel stack trace export. Only valid with the post action. | false |
| rateLimit | string | A time period within which repeated messages will not be posted. Can be
specified in seconds (default or with 's' suffix), minutes ('m' suffix)
or hours ('h' suffix). Only valid with the post action. | false |
| rateLimitScope | string | The scope of the provided rate limit argument. Can be "thread" (default),
"process" (all threads for the same process), or "global". If "thread" is
selected then rate limiting applies per thread; if "process" is selected
then rate limiting applies per process; if "global" is selected then rate
limiting applies regardless of which process or thread caused the action.
Only valid with the post action and with a rateLimit specified. | false |
| userStackTrace | boolean | Enable user stack trace export. Only valid with the post action. | false |
| Name | Type | Description | Required |
|---|---|---|---|
| operator | enum | Filter operation. Enum: Equal, NotEqual, Prefix, NotPrefix, Postfix, NotPostfix, GreaterThan, LessThan, GT, LT, Mask, SPort, NotSPort, SPortPriv, NotSportPriv, DPort, NotDPort, DPortPriv, NotDPortPriv, SAddr, NotSAddr, DAddr, NotDAddr, Protocol, Family, State, InMap, NotInMap, CapabilitiesGained, InRange, NotInRange, SubString, SubStringIgnCase, CelExpr, FileType, NotFileType | true |
| args | []integer | Position of the operator arguments (in spec file) to apply the filter to. | false |
| index | integer | Position of the argument (in function prototype) to apply the filter to. Format: int32 Minimum: 0 | false |
| values | []string | Value to compare the argument against. | false |
| Name | Type | Description | Required |
|---|---|---|---|
| operator | enum | Filter operation. Enum: In, NotIn, Prefix, NotPrefix, Postfix, NotPostfix | true |
| values | []string | Value to compare the argument against. | true |
| followChildren | boolean | In addition to binaries, match children processes of specified binaries. Default: false | false |
| Name | Type | Description | Required |
|---|---|---|---|
| operator | enum | Namespace selector operator. Enum: In, NotIn | true |
| values | []string | Capabilities to match. | true |
| isNamespaceCapability | boolean | Indicates whether these caps are namespace caps. Default: false | false |
| type | enum | Type of capabilities Enum: Effective, Inheritable, Permitted Default: Effective | false |
| Name | Type | Description | Required |
|---|---|---|---|
| operator | enum | Namespace selector operator. Enum: In, NotIn | true |
| values | []string | Capabilities to match. | true |
| isNamespaceCapability | boolean | Indicates whether these caps are namespace caps. Default: false | false |
| type | enum | Type of capabilities Enum: Effective, Inheritable, Permitted Default: Effective | false |
| Name | Type | Description | Required |
|---|---|---|---|
| operator | enum | Filter operation. Enum: Equal, NotEqual, Prefix, NotPrefix, Postfix, NotPostfix, GreaterThan, LessThan, GT, LT, Mask, SPort, NotSPort, SPortPriv, NotSportPriv, DPort, NotDPort, DPortPriv, NotDPortPriv, SAddr, NotSAddr, DAddr, NotDAddr, Protocol, Family, State, InMap, NotInMap, CapabilitiesGained, InRange, NotInRange, SubString, SubStringIgnCase, CelExpr, FileType, NotFileType | true |
| args | []integer | Position of the operator arguments (in spec file) to apply the filter to. | false |
| index | integer | Position of the argument (in function prototype) to apply the filter to. Format: int32 Minimum: 0 | false |
| values | []string | Value to compare the argument against. | false |
| Name | Type | Description | Required |
|---|---|---|---|
| operator | enum | Namespace selector operator. Enum: In, NotIn | true |
| values | []string | Namespace types (e.g., Mnt, Pid) to match. | true |
| Name | Type | Description | Required |
|---|---|---|---|
| namespace | enum | Namespace selector name. Enum: Uts, Ipc, Mnt, Pid, PidForChildren, Net, Time, TimeForChildren, Cgroup, User | true |
| operator | enum | Namespace selector operator. Enum: In, NotIn | true |
| values | []string | Namespace IDs (or host_ns for host namespace) of namespaces to match. | true |
| Name | Type | Description | Required |
|---|---|---|---|
| operator | enum | PID selector operator. Enum: In, NotIn | true |
| values | []integer | Process IDs to match. | true |
| followForks | boolean | Matches any descendant processes of the matching PIDs. Default: false | false |
| isNamespacePID | boolean | Indicates whether PIDs are namespace PIDs. Default: false | false |
| Name | Type | Description | Required |
|---|---|---|---|
| operator | enum | Filter operation. Enum: In, NotIn, Prefix, NotPrefix, Postfix, NotPostfix | true |
| values | []string | Value to compare the argument against. | true |
| followChildren | boolean | In addition to binaries, match children processes of specified binaries. Default: false | false |
| Name | Type | Description | Required |
|---|---|---|---|
| action | enum | Action to execute.
The Override action has three variants, depending on what arguments are set
1. Override the return value of function
Supported hooks: kprobes, uprobes, lsm
Arguments: ArgError (return value)
2. Override the value of a register
Supported hooks: uprobes
Arguments: ArgRegs
3. Override a function call
Supported hooks: uprobes
Arguments: One of:
- ArgNewSymbol: override call to a new symbol (in the binary)
- ArgNewAddr: override call to a new address (in the binary)
- ArgNewOffset: override call to an offset (in the binary) Enum: Post, Sigkill, Override, GetUrl, DnsLookup, NoPost, Signal, TrackSock, UntrackSock, NotifyEnforcer, CleanupEnforcerNotification, Set | true |
| argError | integer | error value for override action Format: int32 | false |
| argFqdn | string | A FQDN to lookup for the dnsLookup action | false |
| argIndex | integer | An arg index for the set action Format: int32 | false |
| argNewAddr | integer | An arg value for the override action, uprobe only.
The new symbol's address.
Beware that the symbol MUST be binary compatible with the traced uprobe symbol. Format: int64 | false |
| argNewOffset | integer | An arg value for the override action, uprobe only.
The new symbol's offset.
Beware that the symbol MUST be binary compatible with the traced uprobe symbol. Format: int64 | false |
| argNewSymbol | string | An arg value for the override action, uprobe only.
The new symbol name.
Beware that the symbol MUST be binary compatible with the traced uprobe symbol. | false |
| argRegs | []string | An arg value for the override action, uprobe only. | false |
| argSig | integer | A signal number for signal action Format: int32 | false |
| argSock | integer | An arg index for the sock for trackSock and untrackSock actions Format: int32 | false |
| argUrl | string | A URL for the getUrl action | false |
| argValue | integer | An arg value for the set action Format: int32 | false |
| imaHash | boolean | Enable collection of file hashes from integrity subsystem.
Only valid with the post action. | false |
| kernelStackTrace | boolean | Enable kernel stack trace export. Only valid with the post action. | false |
| rateLimit | string | A time period within which repeated messages will not be posted. Can be
specified in seconds (default or with 's' suffix), minutes ('m' suffix)
or hours ('h' suffix). Only valid with the post action. | false |
| rateLimitScope | string | The scope of the provided rate limit argument. Can be "thread" (default),
"process" (all threads for the same process), or "global". If "thread" is
selected then rate limiting applies per thread; if "process" is selected
then rate limiting applies per process; if "global" is selected then rate
limiting applies regardless of which process or thread caused the action.
Only valid with the post action and with a rateLimit specified. | false |
| userStackTrace | boolean | Enable user stack trace export. Only valid with the post action. | false |
| Name | Type | Description | Required |
|---|---|---|---|
| operator | enum | Filter operation. Enum: Equal, NotEqual, Prefix, NotPrefix, Postfix, NotPostfix, GreaterThan, LessThan, GT, LT, Mask, SPort, NotSPort, SPortPriv, NotSportPriv, DPort, NotDPort, DPortPriv, NotDPortPriv, SAddr, NotSAddr, DAddr, NotDAddr, Protocol, Family, State, InMap, NotInMap, CapabilitiesGained, InRange, NotInRange, SubString, SubStringIgnCase, CelExpr, FileType, NotFileType | true |
| args | []integer | Position of the operator arguments (in spec file) to apply the filter to. | false |
| index | integer | Position of the argument (in function prototype) to apply the filter to. Format: int32 Minimum: 0 | false |
| values | []string | Value to compare the argument against. | false |
Workloads to match
| Name | Type | Description | Required |
|---|---|---|---|
| containerSelector | object | ContainerSelector selects containers that this policy applies to.
A map of container fields will be constructed in the same way as a map of labels.
The name of the field represents the label "key", and the value of the field - label "value".
Currently, only the "name" field is supported. | false |
| hostSelector | object | HostSelector selects hosts that this policy applies to.
For now only ~ (none) and {} (all) is supported. Validations: | false |
| podSelector | object | PodSelector selects pods that this policy applies to | false |
ContainerSelector selects containers that this policy applies to. A map of container fields will be constructed in the same way as a map of labels. The name of the field represents the label “key”, and the value of the field - label “value”. Currently, only the “name” field is supported.
| Name | Type | Description | Required |
|---|---|---|---|
| matchExpressions | []object | matchExpressions is a list of label selector requirements. The requirements are ANDed. | false |
| matchLabels | map[string]string | matchLabels is a map of {key,value} pairs. A single {key,value} in the matchLabels
map is equivalent to an element of matchExpressions, whose key field is "key", the
operator is "In", and the values array contains only "value". The requirements are ANDed. | false |
A label selector requirement is a selector that contains values, a key, and an operator that relates the key and values.
| Name | Type | Description | Required |
|---|---|---|---|
| key | string | key is the label key that the selector applies to. | true |
| operator | enum | operator represents a key's relationship to a set of values.
Valid operators are In, NotIn, Exists and DoesNotExist. Enum: In, NotIn, Exists, DoesNotExist | true |
| values | []string | values is an array of string values. If the operator is In or NotIn,
the values array must be non-empty. If the operator is Exists or DoesNotExist,
the values array must be empty. This array is replaced during a strategic
merge patch. | false |
HostSelector selects hosts that this policy applies to. For now only ~ (none) and {} (all) is supported.
| Name | Type | Description | Required |
|---|---|---|---|
| matchExpressions | []object | matchExpressions is a list of label selector requirements. The requirements are ANDed. | false |
| matchLabels | map[string]string | matchLabels is a map of {key,value} pairs. A single {key,value} in the matchLabels
map is equivalent to an element of matchExpressions, whose key field is "key", the
operator is "In", and the values array contains only "value". The requirements are ANDed. | false |
A label selector requirement is a selector that contains values, a key, and an operator that relates the key and values.
| Name | Type | Description | Required |
|---|---|---|---|
| key | string | key is the label key that the selector applies to. | true |
| operator | enum | operator represents a key's relationship to a set of values.
Valid operators are In, NotIn, Exists and DoesNotExist. Enum: In, NotIn, Exists, DoesNotExist | true |
| values | []string | values is an array of string values. If the operator is In or NotIn,
the values array must be non-empty. If the operator is Exists or DoesNotExist,
the values array must be empty. This array is replaced during a strategic
merge patch. | false |
PodSelector selects pods that this policy applies to
| Name | Type | Description | Required |
|---|---|---|---|
| matchExpressions | []object | matchExpressions is a list of label selector requirements. The requirements are ANDed. | false |
| matchLabels | map[string]string | matchLabels is a map of {key,value} pairs. A single {key,value} in the matchLabels
map is equivalent to an element of matchExpressions, whose key field is "key", the
operator is "In", and the values array contains only "value". The requirements are ANDed. | false |
A label selector requirement is a selector that contains values, a key, and an operator that relates the key and values.
| Name | Type | Description | Required |
|---|---|---|---|
| key | string | key is the label key that the selector applies to. | true |
| operator | enum | operator represents a key's relationship to a set of values.
Valid operators are In, NotIn, Exists and DoesNotExist. Enum: In, NotIn, Exists, DoesNotExist | true |
| values | []string | values is an array of string values. If the operator is In or NotIn,
the values array must be non-empty. If the operator is Exists or DoesNotExist,
the values array must be empty. This array is replaced during a strategic
merge patch. | false |
HostSelector selects hosts that this policy applies to. For now only ~ (none) and {} (all) is supported.
| Name | Type | Description | Required |
|---|---|---|---|
| matchExpressions | []object | matchExpressions is a list of label selector requirements. The requirements are ANDed. | false |
| matchLabels | map[string]string | matchLabels is a map of {key,value} pairs. A single {key,value} in the matchLabels
map is equivalent to an element of matchExpressions, whose key field is "key", the
operator is "In", and the values array contains only "value". The requirements are ANDed. | false |
A label selector requirement is a selector that contains values, a key, and an operator that relates the key and values.
| Name | Type | Description | Required |
|---|---|---|---|
| key | string | key is the label key that the selector applies to. | true |
| operator | enum | operator represents a key's relationship to a set of values.
Valid operators are In, NotIn, Exists and DoesNotExist. Enum: In, NotIn, Exists, DoesNotExist | true |
| values | []string | values is an array of string values. If the operator is In or NotIn,
the values array must be non-empty. If the operator is Exists or DoesNotExist,
the values array must be empty. This array is replaced during a strategic
merge patch. | false |
| Name | Type | Description | Required |
|---|---|---|---|
| call | string | Name of the function to apply the kprobe spec to. | true |
| args | []object | A list of function arguments to include in the trace output. | false |
| data | []object | A list of data to include in the trace output. | false |
| ignore | object | Conditions for ignoring this kprobe | false |
| message | string | A short message of 256 characters max that will be included
in the event output to inform users what is going on. | false |
| return | boolean | Indicates whether to collect return value of the traced function. Default: false | false |
| returnArg | object | A return argument to include in the trace output. | false |
| returnArgAction | string | An action to perform on the return value.
Use returnArg to include the return value in the event output.
Supported actions are: TrackSock;UntrackSock | false |
| selectors | []object | Selectors to apply before producing trace output. Selectors are ORed and short-circuited. | false |
| syscall | boolean | Indicates whether the traced function is a syscall. Default: true | false |
| tags | []string | Tags to categorize the event, will be include in the event output.
Maximum of 16 Tags are supported. | false |
| Name | Type | Description | Required |
|---|---|---|---|
| index | integer | Position of the argument. Format: int32 Minimum: 0 | true |
| type | enum | Argument type. Enum: auto, int, sint8, int8, uint8, sint16, int16, uint16, uint32, sint32, int32, ulong, uint64, size_t, long, sint64, int64, char_buf, char_iovec, skb, sock, sockaddr, socket, sockaddr_un, string, fd, file, filename, path, nop, bpf_attr, perf_event, bpf_map, user_namespace, capability, kiocb, iov_iter, cred, const_buf, load_info, module, syscall64, kernel_cap_t, cap_inheritable, cap_permitted, cap_effective, linux_binprm, data_loc, net_device, bpf_cmd, dentry, bpf_prog Default: auto | true |
| btfType | string | Type to use as the initial resolve type. For kprobe args it looks up the named struct
from the kernel BTF, casting the argument's type before traversing the resolve path.
For UprobeSpecs and UsdtSpecs it looks up the type from the BTF file defined by BTFPath. | false |
| btfTypeModule | string | Kernel module that contains the BTFType. This is used only for kprobe args.
The module must already be loaded and expose BTF in /sys/kernel/btf. | false |
| label | string | Label to output in the JSON | false |
| maxData | boolean | Read maximum possible data (currently 327360). This field is only used
for char_buff data. When this value is false (default), the bpf program
will fetch at most 4096 bytes. In later kernels (>=5.4) tetragon
supports fetching up to 327360 bytes if this flag is turned on Default: false | false |
| resolve | string | Resolve the path to a specific attribute Default: | false |
| returnCopy | boolean | This field is used only for char_buf and char_iovec types. It indicates
that this argument should be read later (when the kretprobe for the
symbol is triggered) because it might not be populated when the kprobe
is triggered at the entrance of the function. For example, a buffer
supplied to read(2) won't have content until kretprobe is triggered. Default: false | false |
| sizeArgIndex | integer | Specifies the position of the corresponding size argument for this argument.
This field is used only for char_buf and char_iovec types. Format: int32 Minimum: 0 | false |
| source | string | Source of the data, if missing the default if function arguments | false |
| Name | Type | Description | Required |
|---|---|---|---|
| index | integer | Position of the argument. Format: int32 Minimum: 0 | true |
| type | enum | Argument type. Enum: auto, int, sint8, int8, uint8, sint16, int16, uint16, uint32, sint32, int32, ulong, uint64, size_t, long, sint64, int64, char_buf, char_iovec, skb, sock, sockaddr, socket, sockaddr_un, string, fd, file, filename, path, nop, bpf_attr, perf_event, bpf_map, user_namespace, capability, kiocb, iov_iter, cred, const_buf, load_info, module, syscall64, kernel_cap_t, cap_inheritable, cap_permitted, cap_effective, linux_binprm, data_loc, net_device, bpf_cmd, dentry, bpf_prog Default: auto | true |
| btfType | string | Type to use as the initial resolve type. For kprobe args it looks up the named struct
from the kernel BTF, casting the argument's type before traversing the resolve path.
For UprobeSpecs and UsdtSpecs it looks up the type from the BTF file defined by BTFPath. | false |
| btfTypeModule | string | Kernel module that contains the BTFType. This is used only for kprobe args.
The module must already be loaded and expose BTF in /sys/kernel/btf. | false |
| label | string | Label to output in the JSON | false |
| maxData | boolean | Read maximum possible data (currently 327360). This field is only used
for char_buff data. When this value is false (default), the bpf program
will fetch at most 4096 bytes. In later kernels (>=5.4) tetragon
supports fetching up to 327360 bytes if this flag is turned on Default: false | false |
| resolve | string | Resolve the path to a specific attribute Default: | false |
| returnCopy | boolean | This field is used only for char_buf and char_iovec types. It indicates
that this argument should be read later (when the kretprobe for the
symbol is triggered) because it might not be populated when the kprobe
is triggered at the entrance of the function. For example, a buffer
supplied to read(2) won't have content until kretprobe is triggered. Default: false | false |
| sizeArgIndex | integer | Specifies the position of the corresponding size argument for this argument.
This field is used only for char_buf and char_iovec types. Format: int32 Minimum: 0 | false |
| source | string | Source of the data, if missing the default if function arguments | false |
Conditions for ignoring this kprobe
| Name | Type | Description | Required |
|---|---|---|---|
| callNotFound | boolean | Ignores calls that are not present in the system | false |
A return argument to include in the trace output.
| Name | Type | Description | Required |
|---|---|---|---|
| index | integer | Position of the argument. Format: int32 Minimum: 0 | true |
| type | enum | Argument type. Enum: auto, int, sint8, int8, uint8, sint16, int16, uint16, uint32, sint32, int32, ulong, uint64, size_t, long, sint64, int64, char_buf, char_iovec, skb, sock, sockaddr, socket, sockaddr_un, string, fd, file, filename, path, nop, bpf_attr, perf_event, bpf_map, user_namespace, capability, kiocb, iov_iter, cred, const_buf, load_info, module, syscall64, kernel_cap_t, cap_inheritable, cap_permitted, cap_effective, linux_binprm, data_loc, net_device, bpf_cmd, dentry, bpf_prog Default: auto | true |
| btfType | string | Type to use as the initial resolve type. For kprobe args it looks up the named struct
from the kernel BTF, casting the argument's type before traversing the resolve path.
For UprobeSpecs and UsdtSpecs it looks up the type from the BTF file defined by BTFPath. | false |
| btfTypeModule | string | Kernel module that contains the BTFType. This is used only for kprobe args.
The module must already be loaded and expose BTF in /sys/kernel/btf. | false |
| label | string | Label to output in the JSON | false |
| maxData | boolean | Read maximum possible data (currently 327360). This field is only used
for char_buff data. When this value is false (default), the bpf program
will fetch at most 4096 bytes. In later kernels (>=5.4) tetragon
supports fetching up to 327360 bytes if this flag is turned on Default: false | false |
| resolve | string | Resolve the path to a specific attribute Default: | false |
| returnCopy | boolean | This field is used only for char_buf and char_iovec types. It indicates
that this argument should be read later (when the kretprobe for the
symbol is triggered) because it might not be populated when the kprobe
is triggered at the entrance of the function. For example, a buffer
supplied to read(2) won't have content until kretprobe is triggered. Default: false | false |
| sizeArgIndex | integer | Specifies the position of the corresponding size argument for this argument.
This field is used only for char_buf and char_iovec types. Format: int32 Minimum: 0 | false |
| source | string | Source of the data, if missing the default if function arguments | false |
KProbeSelector selects function calls for kprobe based on PIDs and function arguments. The results of MatchPIDs and MatchArgs are ANDed.
| Name | Type | Description | Required |
|---|---|---|---|
| label | string | Human-readable selector label used in status and metrics. | false |
| macros | []string | A list of macros names, defined in spec.selectorsMacros.
Filters specified in macros will be appended to corresponding filters of the selector. | false |
| matchActions | []object | A list of actions to execute when this selector matches | false |
| matchArgs | []object | A list of argument filters. MatchArgs are ANDed. | false |
| matchBinaries | []object | A list of binary exec name filters. | false |
| matchCapabilities | []object | A list of capabilities and IDs | false |
| matchCapabilityChanges | []object | IDs for capabilities changes | false |
| matchData | []object | A list of argument filters. MatchData are ANDed. | false |
| matchNamespaceChanges | []object | IDs for namespace changes | false |
| matchNamespaces | []object | A list of namespaces and IDs | false |
| matchPIDs | []object | A list of process ID filters. MatchPIDs are ANDed. | false |
| matchParentBinaries | []object | A list of process parent exec name filters. | false |
| matchReturnActions | []object | A list of actions to execute when MatchReturnArgs selector matches | false |
| matchReturnArgs | []object | A list of argument filters. MatchReturnArgs are ANDed. | false |
| matchWorkloads | object | Workloads to match | false |
| Name | Type | Description | Required |
|---|---|---|---|
| action | enum | Action to execute.
The Override action has three variants, depending on what arguments are set
1. Override the return value of function
Supported hooks: kprobes, uprobes, lsm
Arguments: ArgError (return value)
2. Override the value of a register
Supported hooks: uprobes
Arguments: ArgRegs
3. Override a function call
Supported hooks: uprobes
Arguments: One of:
- ArgNewSymbol: override call to a new symbol (in the binary)
- ArgNewAddr: override call to a new address (in the binary)
- ArgNewOffset: override call to an offset (in the binary) Enum: Post, Sigkill, Override, GetUrl, DnsLookup, NoPost, Signal, TrackSock, UntrackSock, NotifyEnforcer, CleanupEnforcerNotification, Set | true |
| argError | integer | error value for override action Format: int32 | false |
| argFqdn | string | A FQDN to lookup for the dnsLookup action | false |
| argIndex | integer | An arg index for the set action Format: int32 | false |
| argNewAddr | integer | An arg value for the override action, uprobe only.
The new symbol's address.
Beware that the symbol MUST be binary compatible with the traced uprobe symbol. Format: int64 | false |
| argNewOffset | integer | An arg value for the override action, uprobe only.
The new symbol's offset.
Beware that the symbol MUST be binary compatible with the traced uprobe symbol. Format: int64 | false |
| argNewSymbol | string | An arg value for the override action, uprobe only.
The new symbol name.
Beware that the symbol MUST be binary compatible with the traced uprobe symbol. | false |
| argRegs | []string | An arg value for the override action, uprobe only. | false |
| argSig | integer | A signal number for signal action Format: int32 | false |
| argSock | integer | An arg index for the sock for trackSock and untrackSock actions Format: int32 | false |
| argUrl | string | A URL for the getUrl action | false |
| argValue | integer | An arg value for the set action Format: int32 | false |
| imaHash | boolean | Enable collection of file hashes from integrity subsystem.
Only valid with the post action. | false |
| kernelStackTrace | boolean | Enable kernel stack trace export. Only valid with the post action. | false |
| rateLimit | string | A time period within which repeated messages will not be posted. Can be
specified in seconds (default or with 's' suffix), minutes ('m' suffix)
or hours ('h' suffix). Only valid with the post action. | false |
| rateLimitScope | string | The scope of the provided rate limit argument. Can be "thread" (default),
"process" (all threads for the same process), or "global". If "thread" is
selected then rate limiting applies per thread; if "process" is selected
then rate limiting applies per process; if "global" is selected then rate
limiting applies regardless of which process or thread caused the action.
Only valid with the post action and with a rateLimit specified. | false |
| userStackTrace | boolean | Enable user stack trace export. Only valid with the post action. | false |
| Name | Type | Description | Required |
|---|---|---|---|
| operator | enum | Filter operation. Enum: Equal, NotEqual, Prefix, NotPrefix, Postfix, NotPostfix, GreaterThan, LessThan, GT, LT, Mask, SPort, NotSPort, SPortPriv, NotSportPriv, DPort, NotDPort, DPortPriv, NotDPortPriv, SAddr, NotSAddr, DAddr, NotDAddr, Protocol, Family, State, InMap, NotInMap, CapabilitiesGained, InRange, NotInRange, SubString, SubStringIgnCase, CelExpr, FileType, NotFileType | true |
| args | []integer | Position of the operator arguments (in spec file) to apply the filter to. | false |
| index | integer | Position of the argument (in function prototype) to apply the filter to. Format: int32 Minimum: 0 | false |
| values | []string | Value to compare the argument against. | false |
| Name | Type | Description | Required |
|---|---|---|---|
| operator | enum | Filter operation. Enum: In, NotIn, Prefix, NotPrefix, Postfix, NotPostfix | true |
| values | []string | Value to compare the argument against. | true |
| followChildren | boolean | In addition to binaries, match children processes of specified binaries. Default: false | false |
| Name | Type | Description | Required |
|---|---|---|---|
| operator | enum | Namespace selector operator. Enum: In, NotIn | true |
| values | []string | Capabilities to match. | true |
| isNamespaceCapability | boolean | Indicates whether these caps are namespace caps. Default: false | false |
| type | enum | Type of capabilities Enum: Effective, Inheritable, Permitted Default: Effective | false |
| Name | Type | Description | Required |
|---|---|---|---|
| operator | enum | Namespace selector operator. Enum: In, NotIn | true |
| values | []string | Capabilities to match. | true |
| isNamespaceCapability | boolean | Indicates whether these caps are namespace caps. Default: false | false |
| type | enum | Type of capabilities Enum: Effective, Inheritable, Permitted Default: Effective | false |
| Name | Type | Description | Required |
|---|---|---|---|
| operator | enum | Filter operation. Enum: Equal, NotEqual, Prefix, NotPrefix, Postfix, NotPostfix, GreaterThan, LessThan, GT, LT, Mask, SPort, NotSPort, SPortPriv, NotSportPriv, DPort, NotDPort, DPortPriv, NotDPortPriv, SAddr, NotSAddr, DAddr, NotDAddr, Protocol, Family, State, InMap, NotInMap, CapabilitiesGained, InRange, NotInRange, SubString, SubStringIgnCase, CelExpr, FileType, NotFileType | true |
| args | []integer | Position of the operator arguments (in spec file) to apply the filter to. | false |
| index | integer | Position of the argument (in function prototype) to apply the filter to. Format: int32 Minimum: 0 | false |
| values | []string | Value to compare the argument against. | false |
| Name | Type | Description | Required |
|---|---|---|---|
| operator | enum | Namespace selector operator. Enum: In, NotIn | true |
| values | []string | Namespace types (e.g., Mnt, Pid) to match. | true |
| Name | Type | Description | Required |
|---|---|---|---|
| namespace | enum | Namespace selector name. Enum: Uts, Ipc, Mnt, Pid, PidForChildren, Net, Time, TimeForChildren, Cgroup, User | true |
| operator | enum | Namespace selector operator. Enum: In, NotIn | true |
| values | []string | Namespace IDs (or host_ns for host namespace) of namespaces to match. | true |
| Name | Type | Description | Required |
|---|---|---|---|
| operator | enum | PID selector operator. Enum: In, NotIn | true |
| values | []integer | Process IDs to match. | true |
| followForks | boolean | Matches any descendant processes of the matching PIDs. Default: false | false |
| isNamespacePID | boolean | Indicates whether PIDs are namespace PIDs. Default: false | false |
| Name | Type | Description | Required |
|---|---|---|---|
| operator | enum | Filter operation. Enum: In, NotIn, Prefix, NotPrefix, Postfix, NotPostfix | true |
| values | []string | Value to compare the argument against. | true |
| followChildren | boolean | In addition to binaries, match children processes of specified binaries. Default: false | false |
| Name | Type | Description | Required |
|---|---|---|---|
| action | enum | Action to execute.
The Override action has three variants, depending on what arguments are set
1. Override the return value of function
Supported hooks: kprobes, uprobes, lsm
Arguments: ArgError (return value)
2. Override the value of a register
Supported hooks: uprobes
Arguments: ArgRegs
3. Override a function call
Supported hooks: uprobes
Arguments: One of:
- ArgNewSymbol: override call to a new symbol (in the binary)
- ArgNewAddr: override call to a new address (in the binary)
- ArgNewOffset: override call to an offset (in the binary) Enum: Post, Sigkill, Override, GetUrl, DnsLookup, NoPost, Signal, TrackSock, UntrackSock, NotifyEnforcer, CleanupEnforcerNotification, Set | true |
| argError | integer | error value for override action Format: int32 | false |
| argFqdn | string | A FQDN to lookup for the dnsLookup action | false |
| argIndex | integer | An arg index for the set action Format: int32 | false |
| argNewAddr | integer | An arg value for the override action, uprobe only.
The new symbol's address.
Beware that the symbol MUST be binary compatible with the traced uprobe symbol. Format: int64 | false |
| argNewOffset | integer | An arg value for the override action, uprobe only.
The new symbol's offset.
Beware that the symbol MUST be binary compatible with the traced uprobe symbol. Format: int64 | false |
| argNewSymbol | string | An arg value for the override action, uprobe only.
The new symbol name.
Beware that the symbol MUST be binary compatible with the traced uprobe symbol. | false |
| argRegs | []string | An arg value for the override action, uprobe only. | false |
| argSig | integer | A signal number for signal action Format: int32 | false |
| argSock | integer | An arg index for the sock for trackSock and untrackSock actions Format: int32 | false |
| argUrl | string | A URL for the getUrl action | false |
| argValue | integer | An arg value for the set action Format: int32 | false |
| imaHash | boolean | Enable collection of file hashes from integrity subsystem.
Only valid with the post action. | false |
| kernelStackTrace | boolean | Enable kernel stack trace export. Only valid with the post action. | false |
| rateLimit | string | A time period within which repeated messages will not be posted. Can be
specified in seconds (default or with 's' suffix), minutes ('m' suffix)
or hours ('h' suffix). Only valid with the post action. | false |
| rateLimitScope | string | The scope of the provided rate limit argument. Can be "thread" (default),
"process" (all threads for the same process), or "global". If "thread" is
selected then rate limiting applies per thread; if "process" is selected
then rate limiting applies per process; if "global" is selected then rate
limiting applies regardless of which process or thread caused the action.
Only valid with the post action and with a rateLimit specified. | false |
| userStackTrace | boolean | Enable user stack trace export. Only valid with the post action. | false |
| Name | Type | Description | Required |
|---|---|---|---|
| operator | enum | Filter operation. Enum: Equal, NotEqual, Prefix, NotPrefix, Postfix, NotPostfix, GreaterThan, LessThan, GT, LT, Mask, SPort, NotSPort, SPortPriv, NotSportPriv, DPort, NotDPort, DPortPriv, NotDPortPriv, SAddr, NotSAddr, DAddr, NotDAddr, Protocol, Family, State, InMap, NotInMap, CapabilitiesGained, InRange, NotInRange, SubString, SubStringIgnCase, CelExpr, FileType, NotFileType | true |
| args | []integer | Position of the operator arguments (in spec file) to apply the filter to. | false |
| index | integer | Position of the argument (in function prototype) to apply the filter to. Format: int32 Minimum: 0 | false |
| values | []string | Value to compare the argument against. | false |
Workloads to match
| Name | Type | Description | Required |
|---|---|---|---|
| containerSelector | object | ContainerSelector selects containers that this policy applies to.
A map of container fields will be constructed in the same way as a map of labels.
The name of the field represents the label "key", and the value of the field - label "value".
Currently, only the "name" field is supported. | false |
| hostSelector | object | HostSelector selects hosts that this policy applies to.
For now only ~ (none) and {} (all) is supported. Validations: | false |
| podSelector | object | PodSelector selects pods that this policy applies to | false |
ContainerSelector selects containers that this policy applies to. A map of container fields will be constructed in the same way as a map of labels. The name of the field represents the label “key”, and the value of the field - label “value”. Currently, only the “name” field is supported.
| Name | Type | Description | Required |
|---|---|---|---|
| matchExpressions | []object | matchExpressions is a list of label selector requirements. The requirements are ANDed. | false |
| matchLabels | map[string]string | matchLabels is a map of {key,value} pairs. A single {key,value} in the matchLabels
map is equivalent to an element of matchExpressions, whose key field is "key", the
operator is "In", and the values array contains only "value". The requirements are ANDed. | false |
A label selector requirement is a selector that contains values, a key, and an operator that relates the key and values.
| Name | Type | Description | Required |
|---|---|---|---|
| key | string | key is the label key that the selector applies to. | true |
| operator | enum | operator represents a key's relationship to a set of values.
Valid operators are In, NotIn, Exists and DoesNotExist. Enum: In, NotIn, Exists, DoesNotExist | true |
| values | []string | values is an array of string values. If the operator is In or NotIn,
the values array must be non-empty. If the operator is Exists or DoesNotExist,
the values array must be empty. This array is replaced during a strategic
merge patch. | false |
HostSelector selects hosts that this policy applies to. For now only ~ (none) and {} (all) is supported.
| Name | Type | Description | Required |
|---|---|---|---|
| matchExpressions | []object | matchExpressions is a list of label selector requirements. The requirements are ANDed. | false |
| matchLabels | map[string]string | matchLabels is a map of {key,value} pairs. A single {key,value} in the matchLabels
map is equivalent to an element of matchExpressions, whose key field is "key", the
operator is "In", and the values array contains only "value". The requirements are ANDed. | false |
A label selector requirement is a selector that contains values, a key, and an operator that relates the key and values.
| Name | Type | Description | Required |
|---|---|---|---|
| key | string | key is the label key that the selector applies to. | true |
| operator | enum | operator represents a key's relationship to a set of values.
Valid operators are In, NotIn, Exists and DoesNotExist. Enum: In, NotIn, Exists, DoesNotExist | true |
| values | []string | values is an array of string values. If the operator is In or NotIn,
the values array must be non-empty. If the operator is Exists or DoesNotExist,
the values array must be empty. This array is replaced during a strategic
merge patch. | false |
PodSelector selects pods that this policy applies to
| Name | Type | Description | Required |
|---|---|---|---|
| matchExpressions | []object | matchExpressions is a list of label selector requirements. The requirements are ANDed. | false |
| matchLabels | map[string]string | matchLabels is a map of {key,value} pairs. A single {key,value} in the matchLabels
map is equivalent to an element of matchExpressions, whose key field is "key", the
operator is "In", and the values array contains only "value". The requirements are ANDed. | false |
A label selector requirement is a selector that contains values, a key, and an operator that relates the key and values.
| Name | Type | Description | Required |
|---|---|---|---|
| key | string | key is the label key that the selector applies to. | true |
| operator | enum | operator represents a key's relationship to a set of values.
Valid operators are In, NotIn, Exists and DoesNotExist. Enum: In, NotIn, Exists, DoesNotExist | true |
| values | []string | values is an array of string values. If the operator is In or NotIn,
the values array must be non-empty. If the operator is Exists or DoesNotExist,
the values array must be empty. This array is replaced during a strategic
merge patch. | false |
| Name | Type | Description | Required |
|---|---|---|---|
| name | string | Name of the list | true |
| pattern | string | Pattern for 'generated' lists. | false |
| type | enum | Indicates the type of the list values. Enum: syscalls, generated_syscalls, generated_ftrace | false |
| validated | boolean | List was validated | false |
| values | []string | Values of the list | false |
| Name | Type | Description | Required |
|---|---|---|---|
| hook | string | Name of the function to apply the kprobe spec to. | true |
| args | []object | A list of function arguments to include in the trace output. | false |
| message | string | A short message of 256 characters max that will be included
in the event output to inform users what is going on. | false |
| selectors | []object | Selectors to apply before producing trace output. Selectors are ORed. | false |
| tags | []string | Tags to categorize the event, will be include in the event output.
Maximum of 16 Tags are supported. | false |
| Name | Type | Description | Required |
|---|---|---|---|
| index | integer | Position of the argument. Format: int32 Minimum: 0 | true |
| type | enum | Argument type. Enum: auto, int, sint8, int8, uint8, sint16, int16, uint16, uint32, sint32, int32, ulong, uint64, size_t, long, sint64, int64, char_buf, char_iovec, skb, sock, sockaddr, socket, sockaddr_un, string, fd, file, filename, path, nop, bpf_attr, perf_event, bpf_map, user_namespace, capability, kiocb, iov_iter, cred, const_buf, load_info, module, syscall64, kernel_cap_t, cap_inheritable, cap_permitted, cap_effective, linux_binprm, data_loc, net_device, bpf_cmd, dentry, bpf_prog Default: auto | true |
| btfType | string | Type to use as the initial resolve type. For kprobe args it looks up the named struct
from the kernel BTF, casting the argument's type before traversing the resolve path.
For UprobeSpecs and UsdtSpecs it looks up the type from the BTF file defined by BTFPath. | false |
| btfTypeModule | string | Kernel module that contains the BTFType. This is used only for kprobe args.
The module must already be loaded and expose BTF in /sys/kernel/btf. | false |
| label | string | Label to output in the JSON | false |
| maxData | boolean | Read maximum possible data (currently 327360). This field is only used
for char_buff data. When this value is false (default), the bpf program
will fetch at most 4096 bytes. In later kernels (>=5.4) tetragon
supports fetching up to 327360 bytes if this flag is turned on Default: false | false |
| resolve | string | Resolve the path to a specific attribute Default: | false |
| returnCopy | boolean | This field is used only for char_buf and char_iovec types. It indicates
that this argument should be read later (when the kretprobe for the
symbol is triggered) because it might not be populated when the kprobe
is triggered at the entrance of the function. For example, a buffer
supplied to read(2) won't have content until kretprobe is triggered. Default: false | false |
| sizeArgIndex | integer | Specifies the position of the corresponding size argument for this argument.
This field is used only for char_buf and char_iovec types. Format: int32 Minimum: 0 | false |
| source | string | Source of the data, if missing the default if function arguments | false |
KProbeSelector selects function calls for kprobe based on PIDs and function arguments. The results of MatchPIDs and MatchArgs are ANDed.
| Name | Type | Description | Required |
|---|---|---|---|
| label | string | Human-readable selector label used in status and metrics. | false |
| macros | []string | A list of macros names, defined in spec.selectorsMacros.
Filters specified in macros will be appended to corresponding filters of the selector. | false |
| matchActions | []object | A list of actions to execute when this selector matches | false |
| matchArgs | []object | A list of argument filters. MatchArgs are ANDed. | false |
| matchBinaries | []object | A list of binary exec name filters. | false |
| matchCapabilities | []object | A list of capabilities and IDs | false |
| matchCapabilityChanges | []object | IDs for capabilities changes | false |
| matchData | []object | A list of argument filters. MatchData are ANDed. | false |
| matchNamespaceChanges | []object | IDs for namespace changes | false |
| matchNamespaces | []object | A list of namespaces and IDs | false |
| matchPIDs | []object | A list of process ID filters. MatchPIDs are ANDed. | false |
| matchParentBinaries | []object | A list of process parent exec name filters. | false |
| matchReturnActions | []object | A list of actions to execute when MatchReturnArgs selector matches | false |
| matchReturnArgs | []object | A list of argument filters. MatchReturnArgs are ANDed. | false |
| matchWorkloads | object | Workloads to match | false |
| Name | Type | Description | Required |
|---|---|---|---|
| action | enum | Action to execute.
The Override action has three variants, depending on what arguments are set
1. Override the return value of function
Supported hooks: kprobes, uprobes, lsm
Arguments: ArgError (return value)
2. Override the value of a register
Supported hooks: uprobes
Arguments: ArgRegs
3. Override a function call
Supported hooks: uprobes
Arguments: One of:
- ArgNewSymbol: override call to a new symbol (in the binary)
- ArgNewAddr: override call to a new address (in the binary)
- ArgNewOffset: override call to an offset (in the binary) Enum: Post, Sigkill, Override, GetUrl, DnsLookup, NoPost, Signal, TrackSock, UntrackSock, NotifyEnforcer, CleanupEnforcerNotification, Set | true |
| argError | integer | error value for override action Format: int32 | false |
| argFqdn | string | A FQDN to lookup for the dnsLookup action | false |
| argIndex | integer | An arg index for the set action Format: int32 | false |
| argNewAddr | integer | An arg value for the override action, uprobe only.
The new symbol's address.
Beware that the symbol MUST be binary compatible with the traced uprobe symbol. Format: int64 | false |
| argNewOffset | integer | An arg value for the override action, uprobe only.
The new symbol's offset.
Beware that the symbol MUST be binary compatible with the traced uprobe symbol. Format: int64 | false |
| argNewSymbol | string | An arg value for the override action, uprobe only.
The new symbol name.
Beware that the symbol MUST be binary compatible with the traced uprobe symbol. | false |
| argRegs | []string | An arg value for the override action, uprobe only. | false |
| argSig | integer | A signal number for signal action Format: int32 | false |
| argSock | integer | An arg index for the sock for trackSock and untrackSock actions Format: int32 | false |
| argUrl | string | A URL for the getUrl action | false |
| argValue | integer | An arg value for the set action Format: int32 | false |
| imaHash | boolean | Enable collection of file hashes from integrity subsystem.
Only valid with the post action. | false |
| kernelStackTrace | boolean | Enable kernel stack trace export. Only valid with the post action. | false |
| rateLimit | string | A time period within which repeated messages will not be posted. Can be
specified in seconds (default or with 's' suffix), minutes ('m' suffix)
or hours ('h' suffix). Only valid with the post action. | false |
| rateLimitScope | string | The scope of the provided rate limit argument. Can be "thread" (default),
"process" (all threads for the same process), or "global". If "thread" is
selected then rate limiting applies per thread; if "process" is selected
then rate limiting applies per process; if "global" is selected then rate
limiting applies regardless of which process or thread caused the action.
Only valid with the post action and with a rateLimit specified. | false |
| userStackTrace | boolean | Enable user stack trace export. Only valid with the post action. | false |
| Name | Type | Description | Required |
|---|---|---|---|
| operator | enum | Filter operation. Enum: Equal, NotEqual, Prefix, NotPrefix, Postfix, NotPostfix, GreaterThan, LessThan, GT, LT, Mask, SPort, NotSPort, SPortPriv, NotSportPriv, DPort, NotDPort, DPortPriv, NotDPortPriv, SAddr, NotSAddr, DAddr, NotDAddr, Protocol, Family, State, InMap, NotInMap, CapabilitiesGained, InRange, NotInRange, SubString, SubStringIgnCase, CelExpr, FileType, NotFileType | true |
| args | []integer | Position of the operator arguments (in spec file) to apply the filter to. | false |
| index | integer | Position of the argument (in function prototype) to apply the filter to. Format: int32 Minimum: 0 | false |
| values | []string | Value to compare the argument against. | false |
| Name | Type | Description | Required |
|---|---|---|---|
| operator | enum | Filter operation. Enum: In, NotIn, Prefix, NotPrefix, Postfix, NotPostfix | true |
| values | []string | Value to compare the argument against. | true |
| followChildren | boolean | In addition to binaries, match children processes of specified binaries. Default: false | false |
| Name | Type | Description | Required |
|---|---|---|---|
| operator | enum | Namespace selector operator. Enum: In, NotIn | true |
| values | []string | Capabilities to match. | true |
| isNamespaceCapability | boolean | Indicates whether these caps are namespace caps. Default: false | false |
| type | enum | Type of capabilities Enum: Effective, Inheritable, Permitted Default: Effective | false |
| Name | Type | Description | Required |
|---|---|---|---|
| operator | enum | Namespace selector operator. Enum: In, NotIn | true |
| values | []string | Capabilities to match. | true |
| isNamespaceCapability | boolean | Indicates whether these caps are namespace caps. Default: false | false |
| type | enum | Type of capabilities Enum: Effective, Inheritable, Permitted Default: Effective | false |
| Name | Type | Description | Required |
|---|---|---|---|
| operator | enum | Filter operation. Enum: Equal, NotEqual, Prefix, NotPrefix, Postfix, NotPostfix, GreaterThan, LessThan, GT, LT, Mask, SPort, NotSPort, SPortPriv, NotSportPriv, DPort, NotDPort, DPortPriv, NotDPortPriv, SAddr, NotSAddr, DAddr, NotDAddr, Protocol, Family, State, InMap, NotInMap, CapabilitiesGained, InRange, NotInRange, SubString, SubStringIgnCase, CelExpr, FileType, NotFileType | true |
| args | []integer | Position of the operator arguments (in spec file) to apply the filter to. | false |
| index | integer | Position of the argument (in function prototype) to apply the filter to. Format: int32 Minimum: 0 | false |
| values | []string | Value to compare the argument against. | false |
| Name | Type | Description | Required |
|---|---|---|---|
| operator | enum | Namespace selector operator. Enum: In, NotIn | true |
| values | []string | Namespace types (e.g., Mnt, Pid) to match. | true |
| Name | Type | Description | Required |
|---|---|---|---|
| namespace | enum | Namespace selector name. Enum: Uts, Ipc, Mnt, Pid, PidForChildren, Net, Time, TimeForChildren, Cgroup, User | true |
| operator | enum | Namespace selector operator. Enum: In, NotIn | true |
| values | []string | Namespace IDs (or host_ns for host namespace) of namespaces to match. | true |
| Name | Type | Description | Required |
|---|---|---|---|
| operator | enum | PID selector operator. Enum: In, NotIn | true |
| values | []integer | Process IDs to match. | true |
| followForks | boolean | Matches any descendant processes of the matching PIDs. Default: false | false |
| isNamespacePID | boolean | Indicates whether PIDs are namespace PIDs. Default: false | false |
| Name | Type | Description | Required |
|---|---|---|---|
| operator | enum | Filter operation. Enum: In, NotIn, Prefix, NotPrefix, Postfix, NotPostfix | true |
| values | []string | Value to compare the argument against. | true |
| followChildren | boolean | In addition to binaries, match children processes of specified binaries. Default: false | false |
| Name | Type | Description | Required |
|---|---|---|---|
| action | enum | Action to execute.
The Override action has three variants, depending on what arguments are set
1. Override the return value of function
Supported hooks: kprobes, uprobes, lsm
Arguments: ArgError (return value)
2. Override the value of a register
Supported hooks: uprobes
Arguments: ArgRegs
3. Override a function call
Supported hooks: uprobes
Arguments: One of:
- ArgNewSymbol: override call to a new symbol (in the binary)
- ArgNewAddr: override call to a new address (in the binary)
- ArgNewOffset: override call to an offset (in the binary) Enum: Post, Sigkill, Override, GetUrl, DnsLookup, NoPost, Signal, TrackSock, UntrackSock, NotifyEnforcer, CleanupEnforcerNotification, Set | true |
| argError | integer | error value for override action Format: int32 | false |
| argFqdn | string | A FQDN to lookup for the dnsLookup action | false |
| argIndex | integer | An arg index for the set action Format: int32 | false |
| argNewAddr | integer | An arg value for the override action, uprobe only.
The new symbol's address.
Beware that the symbol MUST be binary compatible with the traced uprobe symbol. Format: int64 | false |
| argNewOffset | integer | An arg value for the override action, uprobe only.
The new symbol's offset.
Beware that the symbol MUST be binary compatible with the traced uprobe symbol. Format: int64 | false |
| argNewSymbol | string | An arg value for the override action, uprobe only.
The new symbol name.
Beware that the symbol MUST be binary compatible with the traced uprobe symbol. | false |
| argRegs | []string | An arg value for the override action, uprobe only. | false |
| argSig | integer | A signal number for signal action Format: int32 | false |
| argSock | integer | An arg index for the sock for trackSock and untrackSock actions Format: int32 | false |
| argUrl | string | A URL for the getUrl action | false |
| argValue | integer | An arg value for the set action Format: int32 | false |
| imaHash | boolean | Enable collection of file hashes from integrity subsystem.
Only valid with the post action. | false |
| kernelStackTrace | boolean | Enable kernel stack trace export. Only valid with the post action. | false |
| rateLimit | string | A time period within which repeated messages will not be posted. Can be
specified in seconds (default or with 's' suffix), minutes ('m' suffix)
or hours ('h' suffix). Only valid with the post action. | false |
| rateLimitScope | string | The scope of the provided rate limit argument. Can be "thread" (default),
"process" (all threads for the same process), or "global". If "thread" is
selected then rate limiting applies per thread; if "process" is selected
then rate limiting applies per process; if "global" is selected then rate
limiting applies regardless of which process or thread caused the action.
Only valid with the post action and with a rateLimit specified. | false |
| userStackTrace | boolean | Enable user stack trace export. Only valid with the post action. | false |
| Name | Type | Description | Required |
|---|---|---|---|
| operator | enum | Filter operation. Enum: Equal, NotEqual, Prefix, NotPrefix, Postfix, NotPostfix, GreaterThan, LessThan, GT, LT, Mask, SPort, NotSPort, SPortPriv, NotSportPriv, DPort, NotDPort, DPortPriv, NotDPortPriv, SAddr, NotSAddr, DAddr, NotDAddr, Protocol, Family, State, InMap, NotInMap, CapabilitiesGained, InRange, NotInRange, SubString, SubStringIgnCase, CelExpr, FileType, NotFileType | true |
| args | []integer | Position of the operator arguments (in spec file) to apply the filter to. | false |
| index | integer | Position of the argument (in function prototype) to apply the filter to. Format: int32 Minimum: 0 | false |
| values | []string | Value to compare the argument against. | false |
Workloads to match
| Name | Type | Description | Required |
|---|---|---|---|
| containerSelector | object | ContainerSelector selects containers that this policy applies to.
A map of container fields will be constructed in the same way as a map of labels.
The name of the field represents the label "key", and the value of the field - label "value".
Currently, only the "name" field is supported. | false |
| hostSelector | object | HostSelector selects hosts that this policy applies to.
For now only ~ (none) and {} (all) is supported. Validations: | false |
| podSelector | object | PodSelector selects pods that this policy applies to | false |
ContainerSelector selects containers that this policy applies to. A map of container fields will be constructed in the same way as a map of labels. The name of the field represents the label “key”, and the value of the field - label “value”. Currently, only the “name” field is supported.
| Name | Type | Description | Required |
|---|---|---|---|
| matchExpressions | []object | matchExpressions is a list of label selector requirements. The requirements are ANDed. | false |
| matchLabels | map[string]string | matchLabels is a map of {key,value} pairs. A single {key,value} in the matchLabels
map is equivalent to an element of matchExpressions, whose key field is "key", the
operator is "In", and the values array contains only "value". The requirements are ANDed. | false |
A label selector requirement is a selector that contains values, a key, and an operator that relates the key and values.
| Name | Type | Description | Required |
|---|---|---|---|
| key | string | key is the label key that the selector applies to. | true |
| operator | enum | operator represents a key's relationship to a set of values.
Valid operators are In, NotIn, Exists and DoesNotExist. Enum: In, NotIn, Exists, DoesNotExist | true |
| values | []string | values is an array of string values. If the operator is In or NotIn,
the values array must be non-empty. If the operator is Exists or DoesNotExist,
the values array must be empty. This array is replaced during a strategic
merge patch. | false |
HostSelector selects hosts that this policy applies to. For now only ~ (none) and {} (all) is supported.
| Name | Type | Description | Required |
|---|---|---|---|
| matchExpressions | []object | matchExpressions is a list of label selector requirements. The requirements are ANDed. | false |
| matchLabels | map[string]string | matchLabels is a map of {key,value} pairs. A single {key,value} in the matchLabels
map is equivalent to an element of matchExpressions, whose key field is "key", the
operator is "In", and the values array contains only "value". The requirements are ANDed. | false |
A label selector requirement is a selector that contains values, a key, and an operator that relates the key and values.
| Name | Type | Description | Required |
|---|---|---|---|
| key | string | key is the label key that the selector applies to. | true |
| operator | enum | operator represents a key's relationship to a set of values.
Valid operators are In, NotIn, Exists and DoesNotExist. Enum: In, NotIn, Exists, DoesNotExist | true |
| values | []string | values is an array of string values. If the operator is In or NotIn,
the values array must be non-empty. If the operator is Exists or DoesNotExist,
the values array must be empty. This array is replaced during a strategic
merge patch. | false |
PodSelector selects pods that this policy applies to
| Name | Type | Description | Required |
|---|---|---|---|
| matchExpressions | []object | matchExpressions is a list of label selector requirements. The requirements are ANDed. | false |
| matchLabels | map[string]string | matchLabels is a map of {key,value} pairs. A single {key,value} in the matchLabels
map is equivalent to an element of matchExpressions, whose key field is "key", the
operator is "In", and the values array contains only "value". The requirements are ANDed. | false |
A label selector requirement is a selector that contains values, a key, and an operator that relates the key and values.
| Name | Type | Description | Required |
|---|---|---|---|
| key | string | key is the label key that the selector applies to. | true |
| operator | enum | operator represents a key's relationship to a set of values.
Valid operators are In, NotIn, Exists and DoesNotExist. Enum: In, NotIn, Exists, DoesNotExist | true |
| values | []string | values is an array of string values. If the operator is In or NotIn,
the values array must be non-empty. If the operator is Exists or DoesNotExist,
the values array must be empty. This array is replaced during a strategic
merge patch. | false |
NodeSelector selects the nodes, by label, on which Tetragon agents load this policy. If empty or unset, the policy is loaded on all nodes. This differs in purpose from hostSelector: nodeSelector controls where a policy is loaded (on which nodes), whereas hostSelector controls which workloads a loaded policy applies to (host vs pod workloads) and does not affect whether the policy is loaded on a node. Use nodeSelector to target a node group such as GPU nodes, a specific architecture or OS, or a canary pool; use hostSelector to scope a loaded policy to host workloads. Unlike hostSelector, nodeSelector supports arbitrary matchLabels and matchExpressions.
| Name | Type | Description | Required |
|---|---|---|---|
| matchExpressions | []object | matchExpressions is a list of label selector requirements. The requirements are ANDed. | false |
| matchLabels | map[string]string | matchLabels is a map of {key,value} pairs. A single {key,value} in the matchLabels
map is equivalent to an element of matchExpressions, whose key field is "key", the
operator is "In", and the values array contains only "value". The requirements are ANDed. | false |
A label selector requirement is a selector that contains values, a key, and an operator that relates the key and values.
| Name | Type | Description | Required |
|---|---|---|---|
| key | string | key is the label key that the selector applies to. | true |
| operator | enum | operator represents a key's relationship to a set of values.
Valid operators are In, NotIn, Exists and DoesNotExist. Enum: In, NotIn, Exists, DoesNotExist | true |
| values | []string | values is an array of string values. If the operator is In or NotIn,
the values array must be non-empty. If the operator is Exists or DoesNotExist,
the values array must be empty. This array is replaced during a strategic
merge patch. | false |
| Name | Type | Description | Required |
|---|---|---|---|
| name | string | Name of the option | true |
| value | string | Value of the option | false |
PodSelector selects pods that this policy applies to
| Name | Type | Description | Required |
|---|---|---|---|
| matchExpressions | []object | matchExpressions is a list of label selector requirements. The requirements are ANDed. | false |
| matchLabels | map[string]string | matchLabels is a map of {key,value} pairs. A single {key,value} in the matchLabels
map is equivalent to an element of matchExpressions, whose key field is "key", the
operator is "In", and the values array contains only "value". The requirements are ANDed. | false |
A label selector requirement is a selector that contains values, a key, and an operator that relates the key and values.
| Name | Type | Description | Required |
|---|---|---|---|
| key | string | key is the label key that the selector applies to. | true |
| operator | enum | operator represents a key's relationship to a set of values.
Valid operators are In, NotIn, Exists and DoesNotExist. Enum: In, NotIn, Exists, DoesNotExist | true |
| values | []string | values is an array of string values. If the operator is In or NotIn,
the values array must be non-empty. If the operator is Exists or DoesNotExist,
the values array must be empty. This array is replaced during a strategic
merge patch. | false |
KProbeSelector selects function calls for kprobe based on PIDs and function arguments. The results of MatchPIDs and MatchArgs are ANDed.
| Name | Type | Description | Required |
|---|---|---|---|
| label | string | Human-readable selector label used in status and metrics. | false |
| macros | []string | A list of macros names, defined in spec.selectorsMacros.
Filters specified in macros will be appended to corresponding filters of the selector. | false |
| matchActions | []object | A list of actions to execute when this selector matches | false |
| matchArgs | []object | A list of argument filters. MatchArgs are ANDed. | false |
| matchBinaries | []object | A list of binary exec name filters. | false |
| matchCapabilities | []object | A list of capabilities and IDs | false |
| matchCapabilityChanges | []object | IDs for capabilities changes | false |
| matchData | []object | A list of argument filters. MatchData are ANDed. | false |
| matchNamespaceChanges | []object | IDs for namespace changes | false |
| matchNamespaces | []object | A list of namespaces and IDs | false |
| matchPIDs | []object | A list of process ID filters. MatchPIDs are ANDed. | false |
| matchParentBinaries | []object | A list of process parent exec name filters. | false |
| matchReturnActions | []object | A list of actions to execute when MatchReturnArgs selector matches | false |
| matchReturnArgs | []object | A list of argument filters. MatchReturnArgs are ANDed. | false |
| matchWorkloads | object | Workloads to match | false |
| Name | Type | Description | Required |
|---|---|---|---|
| action | enum | Action to execute.
The Override action has three variants, depending on what arguments are set
1. Override the return value of function
Supported hooks: kprobes, uprobes, lsm
Arguments: ArgError (return value)
2. Override the value of a register
Supported hooks: uprobes
Arguments: ArgRegs
3. Override a function call
Supported hooks: uprobes
Arguments: One of:
- ArgNewSymbol: override call to a new symbol (in the binary)
- ArgNewAddr: override call to a new address (in the binary)
- ArgNewOffset: override call to an offset (in the binary) Enum: Post, Sigkill, Override, GetUrl, DnsLookup, NoPost, Signal, TrackSock, UntrackSock, NotifyEnforcer, CleanupEnforcerNotification, Set | true |
| argError | integer | error value for override action Format: int32 | false |
| argFqdn | string | A FQDN to lookup for the dnsLookup action | false |
| argIndex | integer | An arg index for the set action Format: int32 | false |
| argNewAddr | integer | An arg value for the override action, uprobe only.
The new symbol's address.
Beware that the symbol MUST be binary compatible with the traced uprobe symbol. Format: int64 | false |
| argNewOffset | integer | An arg value for the override action, uprobe only.
The new symbol's offset.
Beware that the symbol MUST be binary compatible with the traced uprobe symbol. Format: int64 | false |
| argNewSymbol | string | An arg value for the override action, uprobe only.
The new symbol name.
Beware that the symbol MUST be binary compatible with the traced uprobe symbol. | false |
| argRegs | []string | An arg value for the override action, uprobe only. | false |
| argSig | integer | A signal number for signal action Format: int32 | false |
| argSock | integer | An arg index for the sock for trackSock and untrackSock actions Format: int32 | false |
| argUrl | string | A URL for the getUrl action | false |
| argValue | integer | An arg value for the set action Format: int32 | false |
| imaHash | boolean | Enable collection of file hashes from integrity subsystem.
Only valid with the post action. | false |
| kernelStackTrace | boolean | Enable kernel stack trace export. Only valid with the post action. | false |
| rateLimit | string | A time period within which repeated messages will not be posted. Can be
specified in seconds (default or with 's' suffix), minutes ('m' suffix)
or hours ('h' suffix). Only valid with the post action. | false |
| rateLimitScope | string | The scope of the provided rate limit argument. Can be "thread" (default),
"process" (all threads for the same process), or "global". If "thread" is
selected then rate limiting applies per thread; if "process" is selected
then rate limiting applies per process; if "global" is selected then rate
limiting applies regardless of which process or thread caused the action.
Only valid with the post action and with a rateLimit specified. | false |
| userStackTrace | boolean | Enable user stack trace export. Only valid with the post action. | false |
| Name | Type | Description | Required |
|---|---|---|---|
| operator | enum | Filter operation. Enum: Equal, NotEqual, Prefix, NotPrefix, Postfix, NotPostfix, GreaterThan, LessThan, GT, LT, Mask, SPort, NotSPort, SPortPriv, NotSportPriv, DPort, NotDPort, DPortPriv, NotDPortPriv, SAddr, NotSAddr, DAddr, NotDAddr, Protocol, Family, State, InMap, NotInMap, CapabilitiesGained, InRange, NotInRange, SubString, SubStringIgnCase, CelExpr, FileType, NotFileType | true |
| args | []integer | Position of the operator arguments (in spec file) to apply the filter to. | false |
| index | integer | Position of the argument (in function prototype) to apply the filter to. Format: int32 Minimum: 0 | false |
| values | []string | Value to compare the argument against. | false |
| Name | Type | Description | Required |
|---|---|---|---|
| operator | enum | Filter operation. Enum: In, NotIn, Prefix, NotPrefix, Postfix, NotPostfix | true |
| values | []string | Value to compare the argument against. | true |
| followChildren | boolean | In addition to binaries, match children processes of specified binaries. Default: false | false |
| Name | Type | Description | Required |
|---|---|---|---|
| operator | enum | Namespace selector operator. Enum: In, NotIn | true |
| values | []string | Capabilities to match. | true |
| isNamespaceCapability | boolean | Indicates whether these caps are namespace caps. Default: false | false |
| type | enum | Type of capabilities Enum: Effective, Inheritable, Permitted Default: Effective | false |
| Name | Type | Description | Required |
|---|---|---|---|
| operator | enum | Namespace selector operator. Enum: In, NotIn | true |
| values | []string | Capabilities to match. | true |
| isNamespaceCapability | boolean | Indicates whether these caps are namespace caps. Default: false | false |
| type | enum | Type of capabilities Enum: Effective, Inheritable, Permitted Default: Effective | false |
| Name | Type | Description | Required |
|---|---|---|---|
| operator | enum | Filter operation. Enum: Equal, NotEqual, Prefix, NotPrefix, Postfix, NotPostfix, GreaterThan, LessThan, GT, LT, Mask, SPort, NotSPort, SPortPriv, NotSportPriv, DPort, NotDPort, DPortPriv, NotDPortPriv, SAddr, NotSAddr, DAddr, NotDAddr, Protocol, Family, State, InMap, NotInMap, CapabilitiesGained, InRange, NotInRange, SubString, SubStringIgnCase, CelExpr, FileType, NotFileType | true |
| args | []integer | Position of the operator arguments (in spec file) to apply the filter to. | false |
| index | integer | Position of the argument (in function prototype) to apply the filter to. Format: int32 Minimum: 0 | false |
| values | []string | Value to compare the argument against. | false |
| Name | Type | Description | Required |
|---|---|---|---|
| operator | enum | Namespace selector operator. Enum: In, NotIn | true |
| values | []string | Namespace types (e.g., Mnt, Pid) to match. | true |
| Name | Type | Description | Required |
|---|---|---|---|
| namespace | enum | Namespace selector name. Enum: Uts, Ipc, Mnt, Pid, PidForChildren, Net, Time, TimeForChildren, Cgroup, User | true |
| operator | enum | Namespace selector operator. Enum: In, NotIn | true |
| values | []string | Namespace IDs (or host_ns for host namespace) of namespaces to match. | true |
| Name | Type | Description | Required |
|---|---|---|---|
| operator | enum | PID selector operator. Enum: In, NotIn | true |
| values | []integer | Process IDs to match. | true |
| followForks | boolean | Matches any descendant processes of the matching PIDs. Default: false | false |
| isNamespacePID | boolean | Indicates whether PIDs are namespace PIDs. Default: false | false |
| Name | Type | Description | Required |
|---|---|---|---|
| operator | enum | Filter operation. Enum: In, NotIn, Prefix, NotPrefix, Postfix, NotPostfix | true |
| values | []string | Value to compare the argument against. | true |
| followChildren | boolean | In addition to binaries, match children processes of specified binaries. Default: false | false |
| Name | Type | Description | Required |
|---|---|---|---|
| action | enum | Action to execute.
The Override action has three variants, depending on what arguments are set
1. Override the return value of function
Supported hooks: kprobes, uprobes, lsm
Arguments: ArgError (return value)
2. Override the value of a register
Supported hooks: uprobes
Arguments: ArgRegs
3. Override a function call
Supported hooks: uprobes
Arguments: One of:
- ArgNewSymbol: override call to a new symbol (in the binary)
- ArgNewAddr: override call to a new address (in the binary)
- ArgNewOffset: override call to an offset (in the binary) Enum: Post, Sigkill, Override, GetUrl, DnsLookup, NoPost, Signal, TrackSock, UntrackSock, NotifyEnforcer, CleanupEnforcerNotification, Set | true |
| argError | integer | error value for override action Format: int32 | false |
| argFqdn | string | A FQDN to lookup for the dnsLookup action | false |
| argIndex | integer | An arg index for the set action Format: int32 | false |
| argNewAddr | integer | An arg value for the override action, uprobe only.
The new symbol's address.
Beware that the symbol MUST be binary compatible with the traced uprobe symbol. Format: int64 | false |
| argNewOffset | integer | An arg value for the override action, uprobe only.
The new symbol's offset.
Beware that the symbol MUST be binary compatible with the traced uprobe symbol. Format: int64 | false |
| argNewSymbol | string | An arg value for the override action, uprobe only.
The new symbol name.
Beware that the symbol MUST be binary compatible with the traced uprobe symbol. | false |
| argRegs | []string | An arg value for the override action, uprobe only. | false |
| argSig | integer | A signal number for signal action Format: int32 | false |
| argSock | integer | An arg index for the sock for trackSock and untrackSock actions Format: int32 | false |
| argUrl | string | A URL for the getUrl action | false |
| argValue | integer | An arg value for the set action Format: int32 | false |
| imaHash | boolean | Enable collection of file hashes from integrity subsystem.
Only valid with the post action. | false |
| kernelStackTrace | boolean | Enable kernel stack trace export. Only valid with the post action. | false |
| rateLimit | string | A time period within which repeated messages will not be posted. Can be
specified in seconds (default or with 's' suffix), minutes ('m' suffix)
or hours ('h' suffix). Only valid with the post action. | false |
| rateLimitScope | string | The scope of the provided rate limit argument. Can be "thread" (default),
"process" (all threads for the same process), or "global". If "thread" is
selected then rate limiting applies per thread; if "process" is selected
then rate limiting applies per process; if "global" is selected then rate
limiting applies regardless of which process or thread caused the action.
Only valid with the post action and with a rateLimit specified. | false |
| userStackTrace | boolean | Enable user stack trace export. Only valid with the post action. | false |
| Name | Type | Description | Required |
|---|---|---|---|
| operator | enum | Filter operation. Enum: Equal, NotEqual, Prefix, NotPrefix, Postfix, NotPostfix, GreaterThan, LessThan, GT, LT, Mask, SPort, NotSPort, SPortPriv, NotSportPriv, DPort, NotDPort, DPortPriv, NotDPortPriv, SAddr, NotSAddr, DAddr, NotDAddr, Protocol, Family, State, InMap, NotInMap, CapabilitiesGained, InRange, NotInRange, SubString, SubStringIgnCase, CelExpr, FileType, NotFileType | true |
| args | []integer | Position of the operator arguments (in spec file) to apply the filter to. | false |
| index | integer | Position of the argument (in function prototype) to apply the filter to. Format: int32 Minimum: 0 | false |
| values | []string | Value to compare the argument against. | false |
Workloads to match
| Name | Type | Description | Required |
|---|---|---|---|
| containerSelector | object | ContainerSelector selects containers that this policy applies to.
A map of container fields will be constructed in the same way as a map of labels.
The name of the field represents the label "key", and the value of the field - label "value".
Currently, only the "name" field is supported. | false |
| hostSelector | object | HostSelector selects hosts that this policy applies to.
For now only ~ (none) and {} (all) is supported. Validations: | false |
| podSelector | object | PodSelector selects pods that this policy applies to | false |
ContainerSelector selects containers that this policy applies to. A map of container fields will be constructed in the same way as a map of labels. The name of the field represents the label “key”, and the value of the field - label “value”. Currently, only the “name” field is supported.
| Name | Type | Description | Required |
|---|---|---|---|
| matchExpressions | []object | matchExpressions is a list of label selector requirements. The requirements are ANDed. | false |
| matchLabels | map[string]string | matchLabels is a map of {key,value} pairs. A single {key,value} in the matchLabels
map is equivalent to an element of matchExpressions, whose key field is "key", the
operator is "In", and the values array contains only "value". The requirements are ANDed. | false |
A label selector requirement is a selector that contains values, a key, and an operator that relates the key and values.
| Name | Type | Description | Required |
|---|---|---|---|
| key | string | key is the label key that the selector applies to. | true |
| operator | enum | operator represents a key's relationship to a set of values.
Valid operators are In, NotIn, Exists and DoesNotExist. Enum: In, NotIn, Exists, DoesNotExist | true |
| values | []string | values is an array of string values. If the operator is In or NotIn,
the values array must be non-empty. If the operator is Exists or DoesNotExist,
the values array must be empty. This array is replaced during a strategic
merge patch. | false |
HostSelector selects hosts that this policy applies to. For now only ~ (none) and {} (all) is supported.
| Name | Type | Description | Required |
|---|---|---|---|
| matchExpressions | []object | matchExpressions is a list of label selector requirements. The requirements are ANDed. | false |
| matchLabels | map[string]string | matchLabels is a map of {key,value} pairs. A single {key,value} in the matchLabels
map is equivalent to an element of matchExpressions, whose key field is "key", the
operator is "In", and the values array contains only "value". The requirements are ANDed. | false |
A label selector requirement is a selector that contains values, a key, and an operator that relates the key and values.
| Name | Type | Description | Required |
|---|---|---|---|
| key | string | key is the label key that the selector applies to. | true |
| operator | enum | operator represents a key's relationship to a set of values.
Valid operators are In, NotIn, Exists and DoesNotExist. Enum: In, NotIn, Exists, DoesNotExist | true |
| values | []string | values is an array of string values. If the operator is In or NotIn,
the values array must be non-empty. If the operator is Exists or DoesNotExist,
the values array must be empty. This array is replaced during a strategic
merge patch. | false |
PodSelector selects pods that this policy applies to
| Name | Type | Description | Required |
|---|---|---|---|
| matchExpressions | []object | matchExpressions is a list of label selector requirements. The requirements are ANDed. | false |
| matchLabels | map[string]string | matchLabels is a map of {key,value} pairs. A single {key,value} in the matchLabels
map is equivalent to an element of matchExpressions, whose key field is "key", the
operator is "In", and the values array contains only "value". The requirements are ANDed. | false |
A label selector requirement is a selector that contains values, a key, and an operator that relates the key and values.
| Name | Type | Description | Required |
|---|---|---|---|
| key | string | key is the label key that the selector applies to. | true |
| operator | enum | operator represents a key's relationship to a set of values.
Valid operators are In, NotIn, Exists and DoesNotExist. Enum: In, NotIn, Exists, DoesNotExist | true |
| values | []string | values is an array of string values. If the operator is In or NotIn,
the values array must be non-empty. If the operator is Exists or DoesNotExist,
the values array must be empty. This array is replaced during a strategic
merge patch. | false |
| Name | Type | Description | Required |
|---|---|---|---|
| event | string | Tracepoint event | true |
| subsystem | string | Tracepoint subsystem | true |
| args | []object | A list of function arguments to include in the trace output. | false |
| message | string | A short message of 256 characters max that will be included
in the event output to inform users what is going on. | false |
| raw | boolean | Enable raw tracepoint arguments | false |
| selectors | []object | Selectors to apply before producing trace output. Selectors are ORed. | false |
| tags | []string | Tags to categorize the event, will be include in the event output.
Maximum of 16 Tags are supported. | false |
| Name | Type | Description | Required |
|---|---|---|---|
| index | integer | Position of the argument. Format: int32 Minimum: 0 | true |
| type | enum | Argument type. Enum: auto, int, sint8, int8, uint8, sint16, int16, uint16, uint32, sint32, int32, ulong, uint64, size_t, long, sint64, int64, char_buf, char_iovec, skb, sock, sockaddr, socket, sockaddr_un, string, fd, file, filename, path, nop, bpf_attr, perf_event, bpf_map, user_namespace, capability, kiocb, iov_iter, cred, const_buf, load_info, module, syscall64, kernel_cap_t, cap_inheritable, cap_permitted, cap_effective, linux_binprm, data_loc, net_device, bpf_cmd, dentry, bpf_prog Default: auto | true |
| btfType | string | Type to use as the initial resolve type. For kprobe args it looks up the named struct
from the kernel BTF, casting the argument's type before traversing the resolve path.
For UprobeSpecs and UsdtSpecs it looks up the type from the BTF file defined by BTFPath. | false |
| btfTypeModule | string | Kernel module that contains the BTFType. This is used only for kprobe args.
The module must already be loaded and expose BTF in /sys/kernel/btf. | false |
| label | string | Label to output in the JSON | false |
| maxData | boolean | Read maximum possible data (currently 327360). This field is only used
for char_buff data. When this value is false (default), the bpf program
will fetch at most 4096 bytes. In later kernels (>=5.4) tetragon
supports fetching up to 327360 bytes if this flag is turned on Default: false | false |
| resolve | string | Resolve the path to a specific attribute Default: | false |
| returnCopy | boolean | This field is used only for char_buf and char_iovec types. It indicates
that this argument should be read later (when the kretprobe for the
symbol is triggered) because it might not be populated when the kprobe
is triggered at the entrance of the function. For example, a buffer
supplied to read(2) won't have content until kretprobe is triggered. Default: false | false |
| sizeArgIndex | integer | Specifies the position of the corresponding size argument for this argument.
This field is used only for char_buf and char_iovec types. Format: int32 Minimum: 0 | false |
| source | string | Source of the data, if missing the default if function arguments | false |
KProbeSelector selects function calls for kprobe based on PIDs and function arguments. The results of MatchPIDs and MatchArgs are ANDed.
| Name | Type | Description | Required |
|---|---|---|---|
| label | string | Human-readable selector label used in status and metrics. | false |
| macros | []string | A list of macros names, defined in spec.selectorsMacros.
Filters specified in macros will be appended to corresponding filters of the selector. | false |
| matchActions | []object | A list of actions to execute when this selector matches | false |
| matchArgs | []object | A list of argument filters. MatchArgs are ANDed. | false |
| matchBinaries | []object | A list of binary exec name filters. | false |
| matchCapabilities | []object | A list of capabilities and IDs | false |
| matchCapabilityChanges | []object | IDs for capabilities changes | false |
| matchData | []object | A list of argument filters. MatchData are ANDed. | false |
| matchNamespaceChanges | []object | IDs for namespace changes | false |
| matchNamespaces | []object | A list of namespaces and IDs | false |
| matchPIDs | []object | A list of process ID filters. MatchPIDs are ANDed. | false |
| matchParentBinaries | []object | A list of process parent exec name filters. | false |
| matchReturnActions | []object | A list of actions to execute when MatchReturnArgs selector matches | false |
| matchReturnArgs | []object | A list of argument filters. MatchReturnArgs are ANDed. | false |
| matchWorkloads | object | Workloads to match | false |
| Name | Type | Description | Required |
|---|---|---|---|
| action | enum | Action to execute.
The Override action has three variants, depending on what arguments are set
1. Override the return value of function
Supported hooks: kprobes, uprobes, lsm
Arguments: ArgError (return value)
2. Override the value of a register
Supported hooks: uprobes
Arguments: ArgRegs
3. Override a function call
Supported hooks: uprobes
Arguments: One of:
- ArgNewSymbol: override call to a new symbol (in the binary)
- ArgNewAddr: override call to a new address (in the binary)
- ArgNewOffset: override call to an offset (in the binary) Enum: Post, Sigkill, Override, GetUrl, DnsLookup, NoPost, Signal, TrackSock, UntrackSock, NotifyEnforcer, CleanupEnforcerNotification, Set | true |
| argError | integer | error value for override action Format: int32 | false |
| argFqdn | string | A FQDN to lookup for the dnsLookup action | false |
| argIndex | integer | An arg index for the set action Format: int32 | false |
| argNewAddr | integer | An arg value for the override action, uprobe only.
The new symbol's address.
Beware that the symbol MUST be binary compatible with the traced uprobe symbol. Format: int64 | false |
| argNewOffset | integer | An arg value for the override action, uprobe only.
The new symbol's offset.
Beware that the symbol MUST be binary compatible with the traced uprobe symbol. Format: int64 | false |
| argNewSymbol | string | An arg value for the override action, uprobe only.
The new symbol name.
Beware that the symbol MUST be binary compatible with the traced uprobe symbol. | false |
| argRegs | []string | An arg value for the override action, uprobe only. | false |
| argSig | integer | A signal number for signal action Format: int32 | false |
| argSock | integer | An arg index for the sock for trackSock and untrackSock actions Format: int32 | false |
| argUrl | string | A URL for the getUrl action | false |
| argValue | integer | An arg value for the set action Format: int32 | false |
| imaHash | boolean | Enable collection of file hashes from integrity subsystem.
Only valid with the post action. | false |
| kernelStackTrace | boolean | Enable kernel stack trace export. Only valid with the post action. | false |
| rateLimit | string | A time period within which repeated messages will not be posted. Can be
specified in seconds (default or with 's' suffix), minutes ('m' suffix)
or hours ('h' suffix). Only valid with the post action. | false |
| rateLimitScope | string | The scope of the provided rate limit argument. Can be "thread" (default),
"process" (all threads for the same process), or "global". If "thread" is
selected then rate limiting applies per thread; if "process" is selected
then rate limiting applies per process; if "global" is selected then rate
limiting applies regardless of which process or thread caused the action.
Only valid with the post action and with a rateLimit specified. | false |
| userStackTrace | boolean | Enable user stack trace export. Only valid with the post action. | false |
| Name | Type | Description | Required |
|---|---|---|---|
| operator | enum | Filter operation. Enum: Equal, NotEqual, Prefix, NotPrefix, Postfix, NotPostfix, GreaterThan, LessThan, GT, LT, Mask, SPort, NotSPort, SPortPriv, NotSportPriv, DPort, NotDPort, DPortPriv, NotDPortPriv, SAddr, NotSAddr, DAddr, NotDAddr, Protocol, Family, State, InMap, NotInMap, CapabilitiesGained, InRange, NotInRange, SubString, SubStringIgnCase, CelExpr, FileType, NotFileType | true |
| args | []integer | Position of the operator arguments (in spec file) to apply the filter to. | false |
| index | integer | Position of the argument (in function prototype) to apply the filter to. Format: int32 Minimum: 0 | false |
| values | []string | Value to compare the argument against. | false |
| Name | Type | Description | Required |
|---|---|---|---|
| operator | enum | Filter operation. Enum: In, NotIn, Prefix, NotPrefix, Postfix, NotPostfix | true |
| values | []string | Value to compare the argument against. | true |
| followChildren | boolean | In addition to binaries, match children processes of specified binaries. Default: false | false |
| Name | Type | Description | Required |
|---|---|---|---|
| operator | enum | Namespace selector operator. Enum: In, NotIn | true |
| values | []string | Capabilities to match. | true |
| isNamespaceCapability | boolean | Indicates whether these caps are namespace caps. Default: false | false |
| type | enum | Type of capabilities Enum: Effective, Inheritable, Permitted Default: Effective | false |
| Name | Type | Description | Required |
|---|---|---|---|
| operator | enum | Namespace selector operator. Enum: In, NotIn | true |
| values | []string | Capabilities to match. | true |
| isNamespaceCapability | boolean | Indicates whether these caps are namespace caps. Default: false | false |
| type | enum | Type of capabilities Enum: Effective, Inheritable, Permitted Default: Effective | false |
| Name | Type | Description | Required |
|---|---|---|---|
| operator | enum | Filter operation. Enum: Equal, NotEqual, Prefix, NotPrefix, Postfix, NotPostfix, GreaterThan, LessThan, GT, LT, Mask, SPort, NotSPort, SPortPriv, NotSportPriv, DPort, NotDPort, DPortPriv, NotDPortPriv, SAddr, NotSAddr, DAddr, NotDAddr, Protocol, Family, State, InMap, NotInMap, CapabilitiesGained, InRange, NotInRange, SubString, SubStringIgnCase, CelExpr, FileType, NotFileType | true |
| args | []integer | Position of the operator arguments (in spec file) to apply the filter to. | false |
| index | integer | Position of the argument (in function prototype) to apply the filter to. Format: int32 Minimum: 0 | false |
| values | []string | Value to compare the argument against. | false |
| Name | Type | Description | Required |
|---|---|---|---|
| operator | enum | Namespace selector operator. Enum: In, NotIn | true |
| values | []string | Namespace types (e.g., Mnt, Pid) to match. | true |
| Name | Type | Description | Required |
|---|---|---|---|
| namespace | enum | Namespace selector name. Enum: Uts, Ipc, Mnt, Pid, PidForChildren, Net, Time, TimeForChildren, Cgroup, User | true |
| operator | enum | Namespace selector operator. Enum: In, NotIn | true |
| values | []string | Namespace IDs (or host_ns for host namespace) of namespaces to match. | true |
| Name | Type | Description | Required |
|---|---|---|---|
| operator | enum | PID selector operator. Enum: In, NotIn | true |
| values | []integer | Process IDs to match. | true |
| followForks | boolean | Matches any descendant processes of the matching PIDs. Default: false | false |
| isNamespacePID | boolean | Indicates whether PIDs are namespace PIDs. Default: false | false |
| Name | Type | Description | Required |
|---|---|---|---|
| operator | enum | Filter operation. Enum: In, NotIn, Prefix, NotPrefix, Postfix, NotPostfix | true |
| values | []string | Value to compare the argument against. | true |
| followChildren | boolean | In addition to binaries, match children processes of specified binaries. Default: false | false |
| Name | Type | Description | Required |
|---|---|---|---|
| action | enum | Action to execute.
The Override action has three variants, depending on what arguments are set
1. Override the return value of function
Supported hooks: kprobes, uprobes, lsm
Arguments: ArgError (return value)
2. Override the value of a register
Supported hooks: uprobes
Arguments: ArgRegs
3. Override a function call
Supported hooks: uprobes
Arguments: One of:
- ArgNewSymbol: override call to a new symbol (in the binary)
- ArgNewAddr: override call to a new address (in the binary)
- ArgNewOffset: override call to an offset (in the binary) Enum: Post, Sigkill, Override, GetUrl, DnsLookup, NoPost, Signal, TrackSock, UntrackSock, NotifyEnforcer, CleanupEnforcerNotification, Set | true |
| argError | integer | error value for override action Format: int32 | false |
| argFqdn | string | A FQDN to lookup for the dnsLookup action | false |
| argIndex | integer | An arg index for the set action Format: int32 | false |
| argNewAddr | integer | An arg value for the override action, uprobe only.
The new symbol's address.
Beware that the symbol MUST be binary compatible with the traced uprobe symbol. Format: int64 | false |
| argNewOffset | integer | An arg value for the override action, uprobe only.
The new symbol's offset.
Beware that the symbol MUST be binary compatible with the traced uprobe symbol. Format: int64 | false |
| argNewSymbol | string | An arg value for the override action, uprobe only.
The new symbol name.
Beware that the symbol MUST be binary compatible with the traced uprobe symbol. | false |
| argRegs | []string | An arg value for the override action, uprobe only. | false |
| argSig | integer | A signal number for signal action Format: int32 | false |
| argSock | integer | An arg index for the sock for trackSock and untrackSock actions Format: int32 | false |
| argUrl | string | A URL for the getUrl action | false |
| argValue | integer | An arg value for the set action Format: int32 | false |
| imaHash | boolean | Enable collection of file hashes from integrity subsystem.
Only valid with the post action. | false |
| kernelStackTrace | boolean | Enable kernel stack trace export. Only valid with the post action. | false |
| rateLimit | string | A time period within which repeated messages will not be posted. Can be
specified in seconds (default or with 's' suffix), minutes ('m' suffix)
or hours ('h' suffix). Only valid with the post action. | false |
| rateLimitScope | string | The scope of the provided rate limit argument. Can be "thread" (default),
"process" (all threads for the same process), or "global". If "thread" is
selected then rate limiting applies per thread; if "process" is selected
then rate limiting applies per process; if "global" is selected then rate
limiting applies regardless of which process or thread caused the action.
Only valid with the post action and with a rateLimit specified. | false |
| userStackTrace | boolean | Enable user stack trace export. Only valid with the post action. | false |
| Name | Type | Description | Required |
|---|---|---|---|
| operator | enum | Filter operation. Enum: Equal, NotEqual, Prefix, NotPrefix, Postfix, NotPostfix, GreaterThan, LessThan, GT, LT, Mask, SPort, NotSPort, SPortPriv, NotSportPriv, DPort, NotDPort, DPortPriv, NotDPortPriv, SAddr, NotSAddr, DAddr, NotDAddr, Protocol, Family, State, InMap, NotInMap, CapabilitiesGained, InRange, NotInRange, SubString, SubStringIgnCase, CelExpr, FileType, NotFileType | true |
| args | []integer | Position of the operator arguments (in spec file) to apply the filter to. | false |
| index | integer | Position of the argument (in function prototype) to apply the filter to. Format: int32 Minimum: 0 | false |
| values | []string | Value to compare the argument against. | false |
Workloads to match
| Name | Type | Description | Required |
|---|---|---|---|
| containerSelector | object | ContainerSelector selects containers that this policy applies to.
A map of container fields will be constructed in the same way as a map of labels.
The name of the field represents the label "key", and the value of the field - label "value".
Currently, only the "name" field is supported. | false |
| hostSelector | object | HostSelector selects hosts that this policy applies to.
For now only ~ (none) and {} (all) is supported. Validations: | false |
| podSelector | object | PodSelector selects pods that this policy applies to | false |
ContainerSelector selects containers that this policy applies to. A map of container fields will be constructed in the same way as a map of labels. The name of the field represents the label “key”, and the value of the field - label “value”. Currently, only the “name” field is supported.
| Name | Type | Description | Required |
|---|---|---|---|
| matchExpressions | []object | matchExpressions is a list of label selector requirements. The requirements are ANDed. | false |
| matchLabels | map[string]string | matchLabels is a map of {key,value} pairs. A single {key,value} in the matchLabels
map is equivalent to an element of matchExpressions, whose key field is "key", the
operator is "In", and the values array contains only "value". The requirements are ANDed. | false |
A label selector requirement is a selector that contains values, a key, and an operator that relates the key and values.
| Name | Type | Description | Required |
|---|---|---|---|
| key | string | key is the label key that the selector applies to. | true |
| operator | enum | operator represents a key's relationship to a set of values.
Valid operators are In, NotIn, Exists and DoesNotExist. Enum: In, NotIn, Exists, DoesNotExist | true |
| values | []string | values is an array of string values. If the operator is In or NotIn,
the values array must be non-empty. If the operator is Exists or DoesNotExist,
the values array must be empty. This array is replaced during a strategic
merge patch. | false |
HostSelector selects hosts that this policy applies to. For now only ~ (none) and {} (all) is supported.
| Name | Type | Description | Required |
|---|---|---|---|
| matchExpressions | []object | matchExpressions is a list of label selector requirements. The requirements are ANDed. | false |
| matchLabels | map[string]string | matchLabels is a map of {key,value} pairs. A single {key,value} in the matchLabels
map is equivalent to an element of matchExpressions, whose key field is "key", the
operator is "In", and the values array contains only "value". The requirements are ANDed. | false |
A label selector requirement is a selector that contains values, a key, and an operator that relates the key and values.
| Name | Type | Description | Required |
|---|---|---|---|
| key | string | key is the label key that the selector applies to. | true |
| operator | enum | operator represents a key's relationship to a set of values.
Valid operators are In, NotIn, Exists and DoesNotExist. Enum: In, NotIn, Exists, DoesNotExist | true |
| values | []string | values is an array of string values. If the operator is In or NotIn,
the values array must be non-empty. If the operator is Exists or DoesNotExist,
the values array must be empty. This array is replaced during a strategic
merge patch. | false |
PodSelector selects pods that this policy applies to
| Name | Type | Description | Required |
|---|---|---|---|
| matchExpressions | []object | matchExpressions is a list of label selector requirements. The requirements are ANDed. | false |
| matchLabels | map[string]string | matchLabels is a map of {key,value} pairs. A single {key,value} in the matchLabels
map is equivalent to an element of matchExpressions, whose key field is "key", the
operator is "In", and the values array contains only "value". The requirements are ANDed. | false |
A label selector requirement is a selector that contains values, a key, and an operator that relates the key and values.
| Name | Type | Description | Required |
|---|---|---|---|
| key | string | key is the label key that the selector applies to. | true |
| operator | enum | operator represents a key's relationship to a set of values.
Valid operators are In, NotIn, Exists and DoesNotExist. Enum: In, NotIn, Exists, DoesNotExist | true |
| values | []string | values is an array of string values. If the operator is In or NotIn,
the values array must be non-empty. If the operator is Exists or DoesNotExist,
the values array must be empty. This array is replaced during a strategic
merge patch. | false |
| Name | Type | Description | Required |
|---|---|---|---|
| path | string | Name of the traced binary | true |
| addrs | []integer | List of the traced addresses | false |
| args | []object | A list of function arguments to include in the trace output. | false |
| binaryDigests | []string | BinaryDigests specifies a set of digests for the traced binary.
The uprobe/hook is installed only if the digest of the traced binary matches a digest in the set.
Tetragon's tracing policy status API can be used to see each hook's status in order to determine
if the hook was attached or not. | false |
| btfPath | string | path for a BTF file for the traced binary | false |
| data | []object | A list of data to include in the trace output. | false |
| ignore | object | Conditions for ignoring this uprobe | false |
| message | string | A short message of 256 characters max that will be included
in the event output to inform users what is going on. | false |
| offsets | []integer | List of the traced offsets | false |
| refCtrOffsets | []integer | List of the traced ref_ctr_offsets | false |
| return | boolean | Indicates whether to collect return value of the traced function. Default: false | false |
| returnArg | object | A return argument to include in the trace output. | false |
| selectors | []object | Selectors to apply before producing trace output. Selectors are ORed. | false |
| symbols | []string | List of the traced symbols | false |
| tags | []string | Tags to categorize the event, will be include in the event output.
Maximum of 16 Tags are supported. | false |
| Name | Type | Description | Required |
|---|---|---|---|
| index | integer | Position of the argument. Format: int32 Minimum: 0 | true |
| type | enum | Argument type. Enum: auto, int, sint8, int8, uint8, sint16, int16, uint16, uint32, sint32, int32, ulong, uint64, size_t, long, sint64, int64, char_buf, char_iovec, skb, sock, sockaddr, socket, sockaddr_un, string, fd, file, filename, path, nop, bpf_attr, perf_event, bpf_map, user_namespace, capability, kiocb, iov_iter, cred, const_buf, load_info, module, syscall64, kernel_cap_t, cap_inheritable, cap_permitted, cap_effective, linux_binprm, data_loc, net_device, bpf_cmd, dentry, bpf_prog Default: auto | true |
| btfType | string | Type to use as the initial resolve type. For kprobe args it looks up the named struct
from the kernel BTF, casting the argument's type before traversing the resolve path.
For UprobeSpecs and UsdtSpecs it looks up the type from the BTF file defined by BTFPath. | false |
| btfTypeModule | string | Kernel module that contains the BTFType. This is used only for kprobe args.
The module must already be loaded and expose BTF in /sys/kernel/btf. | false |
| label | string | Label to output in the JSON | false |
| maxData | boolean | Read maximum possible data (currently 327360). This field is only used
for char_buff data. When this value is false (default), the bpf program
will fetch at most 4096 bytes. In later kernels (>=5.4) tetragon
supports fetching up to 327360 bytes if this flag is turned on Default: false | false |
| resolve | string | Resolve the path to a specific attribute Default: | false |
| returnCopy | boolean | This field is used only for char_buf and char_iovec types. It indicates
that this argument should be read later (when the kretprobe for the
symbol is triggered) because it might not be populated when the kprobe
is triggered at the entrance of the function. For example, a buffer
supplied to read(2) won't have content until kretprobe is triggered. Default: false | false |
| sizeArgIndex | integer | Specifies the position of the corresponding size argument for this argument.
This field is used only for char_buf and char_iovec types. Format: int32 Minimum: 0 | false |
| source | string | Source of the data, if missing the default if function arguments | false |
| Name | Type | Description | Required |
|---|---|---|---|
| index | integer | Position of the argument. Format: int32 Minimum: 0 | true |
| type | enum | Argument type. Enum: auto, int, sint8, int8, uint8, sint16, int16, uint16, uint32, sint32, int32, ulong, uint64, size_t, long, sint64, int64, char_buf, char_iovec, skb, sock, sockaddr, socket, sockaddr_un, string, fd, file, filename, path, nop, bpf_attr, perf_event, bpf_map, user_namespace, capability, kiocb, iov_iter, cred, const_buf, load_info, module, syscall64, kernel_cap_t, cap_inheritable, cap_permitted, cap_effective, linux_binprm, data_loc, net_device, bpf_cmd, dentry, bpf_prog Default: auto | true |
| btfType | string | Type to use as the initial resolve type. For kprobe args it looks up the named struct
from the kernel BTF, casting the argument's type before traversing the resolve path.
For UprobeSpecs and UsdtSpecs it looks up the type from the BTF file defined by BTFPath. | false |
| btfTypeModule | string | Kernel module that contains the BTFType. This is used only for kprobe args.
The module must already be loaded and expose BTF in /sys/kernel/btf. | false |
| label | string | Label to output in the JSON | false |
| maxData | boolean | Read maximum possible data (currently 327360). This field is only used
for char_buff data. When this value is false (default), the bpf program
will fetch at most 4096 bytes. In later kernels (>=5.4) tetragon
supports fetching up to 327360 bytes if this flag is turned on Default: false | false |
| resolve | string | Resolve the path to a specific attribute Default: | false |
| returnCopy | boolean | This field is used only for char_buf and char_iovec types. It indicates
that this argument should be read later (when the kretprobe for the
symbol is triggered) because it might not be populated when the kprobe
is triggered at the entrance of the function. For example, a buffer
supplied to read(2) won't have content until kretprobe is triggered. Default: false | false |
| sizeArgIndex | integer | Specifies the position of the corresponding size argument for this argument.
This field is used only for char_buf and char_iovec types. Format: int32 Minimum: 0 | false |
| source | string | Source of the data, if missing the default if function arguments | false |
Conditions for ignoring this uprobe
| Name | Type | Description | Required |
|---|---|---|---|
| digestVerificationFailure | boolean | Ignores uprobe where the digest verification of the traced binary fails | false |
A return argument to include in the trace output.
| Name | Type | Description | Required |
|---|---|---|---|
| index | integer | Position of the argument. Format: int32 Minimum: 0 | true |
| type | enum | Argument type. Enum: auto, int, sint8, int8, uint8, sint16, int16, uint16, uint32, sint32, int32, ulong, uint64, size_t, long, sint64, int64, char_buf, char_iovec, skb, sock, sockaddr, socket, sockaddr_un, string, fd, file, filename, path, nop, bpf_attr, perf_event, bpf_map, user_namespace, capability, kiocb, iov_iter, cred, const_buf, load_info, module, syscall64, kernel_cap_t, cap_inheritable, cap_permitted, cap_effective, linux_binprm, data_loc, net_device, bpf_cmd, dentry, bpf_prog Default: auto | true |
| btfType | string | Type to use as the initial resolve type. For kprobe args it looks up the named struct
from the kernel BTF, casting the argument's type before traversing the resolve path.
For UprobeSpecs and UsdtSpecs it looks up the type from the BTF file defined by BTFPath. | false |
| btfTypeModule | string | Kernel module that contains the BTFType. This is used only for kprobe args.
The module must already be loaded and expose BTF in /sys/kernel/btf. | false |
| label | string | Label to output in the JSON | false |
| maxData | boolean | Read maximum possible data (currently 327360). This field is only used
for char_buff data. When this value is false (default), the bpf program
will fetch at most 4096 bytes. In later kernels (>=5.4) tetragon
supports fetching up to 327360 bytes if this flag is turned on Default: false | false |
| resolve | string | Resolve the path to a specific attribute Default: | false |
| returnCopy | boolean | This field is used only for char_buf and char_iovec types. It indicates
that this argument should be read later (when the kretprobe for the
symbol is triggered) because it might not be populated when the kprobe
is triggered at the entrance of the function. For example, a buffer
supplied to read(2) won't have content until kretprobe is triggered. Default: false | false |
| sizeArgIndex | integer | Specifies the position of the corresponding size argument for this argument.
This field is used only for char_buf and char_iovec types. Format: int32 Minimum: 0 | false |
| source | string | Source of the data, if missing the default if function arguments | false |
KProbeSelector selects function calls for kprobe based on PIDs and function arguments. The results of MatchPIDs and MatchArgs are ANDed.
| Name | Type | Description | Required |
|---|---|---|---|
| label | string | Human-readable selector label used in status and metrics. | false |
| macros | []string | A list of macros names, defined in spec.selectorsMacros.
Filters specified in macros will be appended to corresponding filters of the selector. | false |
| matchActions | []object | A list of actions to execute when this selector matches | false |
| matchArgs | []object | A list of argument filters. MatchArgs are ANDed. | false |
| matchBinaries | []object | A list of binary exec name filters. | false |
| matchCapabilities | []object | A list of capabilities and IDs | false |
| matchCapabilityChanges | []object | IDs for capabilities changes | false |
| matchData | []object | A list of argument filters. MatchData are ANDed. | false |
| matchNamespaceChanges | []object | IDs for namespace changes | false |
| matchNamespaces | []object | A list of namespaces and IDs | false |
| matchPIDs | []object | A list of process ID filters. MatchPIDs are ANDed. | false |
| matchParentBinaries | []object | A list of process parent exec name filters. | false |
| matchReturnActions | []object | A list of actions to execute when MatchReturnArgs selector matches | false |
| matchReturnArgs | []object | A list of argument filters. MatchReturnArgs are ANDed. | false |
| matchWorkloads | object | Workloads to match | false |
| Name | Type | Description | Required |
|---|---|---|---|
| action | enum | Action to execute.
The Override action has three variants, depending on what arguments are set
1. Override the return value of function
Supported hooks: kprobes, uprobes, lsm
Arguments: ArgError (return value)
2. Override the value of a register
Supported hooks: uprobes
Arguments: ArgRegs
3. Override a function call
Supported hooks: uprobes
Arguments: One of:
- ArgNewSymbol: override call to a new symbol (in the binary)
- ArgNewAddr: override call to a new address (in the binary)
- ArgNewOffset: override call to an offset (in the binary) Enum: Post, Sigkill, Override, GetUrl, DnsLookup, NoPost, Signal, TrackSock, UntrackSock, NotifyEnforcer, CleanupEnforcerNotification, Set | true |
| argError | integer | error value for override action Format: int32 | false |
| argFqdn | string | A FQDN to lookup for the dnsLookup action | false |
| argIndex | integer | An arg index for the set action Format: int32 | false |
| argNewAddr | integer | An arg value for the override action, uprobe only.
The new symbol's address.
Beware that the symbol MUST be binary compatible with the traced uprobe symbol. Format: int64 | false |
| argNewOffset | integer | An arg value for the override action, uprobe only.
The new symbol's offset.
Beware that the symbol MUST be binary compatible with the traced uprobe symbol. Format: int64 | false |
| argNewSymbol | string | An arg value for the override action, uprobe only.
The new symbol name.
Beware that the symbol MUST be binary compatible with the traced uprobe symbol. | false |
| argRegs | []string | An arg value for the override action, uprobe only. | false |
| argSig | integer | A signal number for signal action Format: int32 | false |
| argSock | integer | An arg index for the sock for trackSock and untrackSock actions Format: int32 | false |
| argUrl | string | A URL for the getUrl action | false |
| argValue | integer | An arg value for the set action Format: int32 | false |
| imaHash | boolean | Enable collection of file hashes from integrity subsystem.
Only valid with the post action. | false |
| kernelStackTrace | boolean | Enable kernel stack trace export. Only valid with the post action. | false |
| rateLimit | string | A time period within which repeated messages will not be posted. Can be
specified in seconds (default or with 's' suffix), minutes ('m' suffix)
or hours ('h' suffix). Only valid with the post action. | false |
| rateLimitScope | string | The scope of the provided rate limit argument. Can be "thread" (default),
"process" (all threads for the same process), or "global". If "thread" is
selected then rate limiting applies per thread; if "process" is selected
then rate limiting applies per process; if "global" is selected then rate
limiting applies regardless of which process or thread caused the action.
Only valid with the post action and with a rateLimit specified. | false |
| userStackTrace | boolean | Enable user stack trace export. Only valid with the post action. | false |
| Name | Type | Description | Required |
|---|---|---|---|
| operator | enum | Filter operation. Enum: Equal, NotEqual, Prefix, NotPrefix, Postfix, NotPostfix, GreaterThan, LessThan, GT, LT, Mask, SPort, NotSPort, SPortPriv, NotSportPriv, DPort, NotDPort, DPortPriv, NotDPortPriv, SAddr, NotSAddr, DAddr, NotDAddr, Protocol, Family, State, InMap, NotInMap, CapabilitiesGained, InRange, NotInRange, SubString, SubStringIgnCase, CelExpr, FileType, NotFileType | true |
| args | []integer | Position of the operator arguments (in spec file) to apply the filter to. | false |
| index | integer | Position of the argument (in function prototype) to apply the filter to. Format: int32 Minimum: 0 | false |
| values | []string | Value to compare the argument against. | false |
| Name | Type | Description | Required |
|---|---|---|---|
| operator | enum | Filter operation. Enum: In, NotIn, Prefix, NotPrefix, Postfix, NotPostfix | true |
| values | []string | Value to compare the argument against. | true |
| followChildren | boolean | In addition to binaries, match children processes of specified binaries. Default: false | false |
| Name | Type | Description | Required |
|---|---|---|---|
| operator | enum | Namespace selector operator. Enum: In, NotIn | true |
| values | []string | Capabilities to match. | true |
| isNamespaceCapability | boolean | Indicates whether these caps are namespace caps. Default: false | false |
| type | enum | Type of capabilities Enum: Effective, Inheritable, Permitted Default: Effective | false |
| Name | Type | Description | Required |
|---|---|---|---|
| operator | enum | Namespace selector operator. Enum: In, NotIn | true |
| values | []string | Capabilities to match. | true |
| isNamespaceCapability | boolean | Indicates whether these caps are namespace caps. Default: false | false |
| type | enum | Type of capabilities Enum: Effective, Inheritable, Permitted Default: Effective | false |
| Name | Type | Description | Required |
|---|---|---|---|
| operator | enum | Filter operation. Enum: Equal, NotEqual, Prefix, NotPrefix, Postfix, NotPostfix, GreaterThan, LessThan, GT, LT, Mask, SPort, NotSPort, SPortPriv, NotSportPriv, DPort, NotDPort, DPortPriv, NotDPortPriv, SAddr, NotSAddr, DAddr, NotDAddr, Protocol, Family, State, InMap, NotInMap, CapabilitiesGained, InRange, NotInRange, SubString, SubStringIgnCase, CelExpr, FileType, NotFileType | true |
| args | []integer | Position of the operator arguments (in spec file) to apply the filter to. | false |
| index | integer | Position of the argument (in function prototype) to apply the filter to. Format: int32 Minimum: 0 | false |
| values | []string | Value to compare the argument against. | false |
| Name | Type | Description | Required |
|---|---|---|---|
| operator | enum | Namespace selector operator. Enum: In, NotIn | true |
| values | []string | Namespace types (e.g., Mnt, Pid) to match. | true |
| Name | Type | Description | Required |
|---|---|---|---|
| namespace | enum | Namespace selector name. Enum: Uts, Ipc, Mnt, Pid, PidForChildren, Net, Time, TimeForChildren, Cgroup, User | true |
| operator | enum | Namespace selector operator. Enum: In, NotIn | true |
| values | []string | Namespace IDs (or host_ns for host namespace) of namespaces to match. | true |
| Name | Type | Description | Required |
|---|---|---|---|
| operator | enum | PID selector operator. Enum: In, NotIn | true |
| values | []integer | Process IDs to match. | true |
| followForks | boolean | Matches any descendant processes of the matching PIDs. Default: false | false |
| isNamespacePID | boolean | Indicates whether PIDs are namespace PIDs. Default: false | false |
| Name | Type | Description | Required |
|---|---|---|---|
| operator | enum | Filter operation. Enum: In, NotIn, Prefix, NotPrefix, Postfix, NotPostfix | true |
| values | []string | Value to compare the argument against. | true |
| followChildren | boolean | In addition to binaries, match children processes of specified binaries. Default: false | false |
| Name | Type | Description | Required |
|---|---|---|---|
| action | enum | Action to execute.
The Override action has three variants, depending on what arguments are set
1. Override the return value of function
Supported hooks: kprobes, uprobes, lsm
Arguments: ArgError (return value)
2. Override the value of a register
Supported hooks: uprobes
Arguments: ArgRegs
3. Override a function call
Supported hooks: uprobes
Arguments: One of:
- ArgNewSymbol: override call to a new symbol (in the binary)
- ArgNewAddr: override call to a new address (in the binary)
- ArgNewOffset: override call to an offset (in the binary) Enum: Post, Sigkill, Override, GetUrl, DnsLookup, NoPost, Signal, TrackSock, UntrackSock, NotifyEnforcer, CleanupEnforcerNotification, Set | true |
| argError | integer | error value for override action Format: int32 | false |
| argFqdn | string | A FQDN to lookup for the dnsLookup action | false |
| argIndex | integer | An arg index for the set action Format: int32 | false |
| argNewAddr | integer | An arg value for the override action, uprobe only.
The new symbol's address.
Beware that the symbol MUST be binary compatible with the traced uprobe symbol. Format: int64 | false |
| argNewOffset | integer | An arg value for the override action, uprobe only.
The new symbol's offset.
Beware that the symbol MUST be binary compatible with the traced uprobe symbol. Format: int64 | false |
| argNewSymbol | string | An arg value for the override action, uprobe only.
The new symbol name.
Beware that the symbol MUST be binary compatible with the traced uprobe symbol. | false |
| argRegs | []string | An arg value for the override action, uprobe only. | false |
| argSig | integer | A signal number for signal action Format: int32 | false |
| argSock | integer | An arg index for the sock for trackSock and untrackSock actions Format: int32 | false |
| argUrl | string | A URL for the getUrl action | false |
| argValue | integer | An arg value for the set action Format: int32 | false |
| imaHash | boolean | Enable collection of file hashes from integrity subsystem.
Only valid with the post action. | false |
| kernelStackTrace | boolean | Enable kernel stack trace export. Only valid with the post action. | false |
| rateLimit | string | A time period within which repeated messages will not be posted. Can be
specified in seconds (default or with 's' suffix), minutes ('m' suffix)
or hours ('h' suffix). Only valid with the post action. | false |
| rateLimitScope | string | The scope of the provided rate limit argument. Can be "thread" (default),
"process" (all threads for the same process), or "global". If "thread" is
selected then rate limiting applies per thread; if "process" is selected
then rate limiting applies per process; if "global" is selected then rate
limiting applies regardless of which process or thread caused the action.
Only valid with the post action and with a rateLimit specified. | false |
| userStackTrace | boolean | Enable user stack trace export. Only valid with the post action. | false |
| Name | Type | Description | Required |
|---|---|---|---|
| operator | enum | Filter operation. Enum: Equal, NotEqual, Prefix, NotPrefix, Postfix, NotPostfix, GreaterThan, LessThan, GT, LT, Mask, SPort, NotSPort, SPortPriv, NotSportPriv, DPort, NotDPort, DPortPriv, NotDPortPriv, SAddr, NotSAddr, DAddr, NotDAddr, Protocol, Family, State, InMap, NotInMap, CapabilitiesGained, InRange, NotInRange, SubString, SubStringIgnCase, CelExpr, FileType, NotFileType | true |
| args | []integer | Position of the operator arguments (in spec file) to apply the filter to. | false |
| index | integer | Position of the argument (in function prototype) to apply the filter to. Format: int32 Minimum: 0 | false |
| values | []string | Value to compare the argument against. | false |
Workloads to match
| Name | Type | Description | Required |
|---|---|---|---|
| containerSelector | object | ContainerSelector selects containers that this policy applies to.
A map of container fields will be constructed in the same way as a map of labels.
The name of the field represents the label "key", and the value of the field - label "value".
Currently, only the "name" field is supported. | false |
| hostSelector | object | HostSelector selects hosts that this policy applies to.
For now only ~ (none) and {} (all) is supported. Validations: | false |
| podSelector | object | PodSelector selects pods that this policy applies to | false |
ContainerSelector selects containers that this policy applies to. A map of container fields will be constructed in the same way as a map of labels. The name of the field represents the label “key”, and the value of the field - label “value”. Currently, only the “name” field is supported.
| Name | Type | Description | Required |
|---|---|---|---|
| matchExpressions | []object | matchExpressions is a list of label selector requirements. The requirements are ANDed. | false |
| matchLabels | map[string]string | matchLabels is a map of {key,value} pairs. A single {key,value} in the matchLabels
map is equivalent to an element of matchExpressions, whose key field is "key", the
operator is "In", and the values array contains only "value". The requirements are ANDed. | false |
A label selector requirement is a selector that contains values, a key, and an operator that relates the key and values.
| Name | Type | Description | Required |
|---|---|---|---|
| key | string | key is the label key that the selector applies to. | true |
| operator | enum | operator represents a key's relationship to a set of values.
Valid operators are In, NotIn, Exists and DoesNotExist. Enum: In, NotIn, Exists, DoesNotExist | true |
| values | []string | values is an array of string values. If the operator is In or NotIn,
the values array must be non-empty. If the operator is Exists or DoesNotExist,
the values array must be empty. This array is replaced during a strategic
merge patch. | false |
HostSelector selects hosts that this policy applies to. For now only ~ (none) and {} (all) is supported.
| Name | Type | Description | Required |
|---|---|---|---|
| matchExpressions | []object | matchExpressions is a list of label selector requirements. The requirements are ANDed. | false |
| matchLabels | map[string]string | matchLabels is a map of {key,value} pairs. A single {key,value} in the matchLabels
map is equivalent to an element of matchExpressions, whose key field is "key", the
operator is "In", and the values array contains only "value". The requirements are ANDed. | false |
A label selector requirement is a selector that contains values, a key, and an operator that relates the key and values.
| Name | Type | Description | Required |
|---|---|---|---|
| key | string | key is the label key that the selector applies to. | true |
| operator | enum | operator represents a key's relationship to a set of values.
Valid operators are In, NotIn, Exists and DoesNotExist. Enum: In, NotIn, Exists, DoesNotExist | true |
| values | []string | values is an array of string values. If the operator is In or NotIn,
the values array must be non-empty. If the operator is Exists or DoesNotExist,
the values array must be empty. This array is replaced during a strategic
merge patch. | false |
PodSelector selects pods that this policy applies to
| Name | Type | Description | Required |
|---|---|---|---|
| matchExpressions | []object | matchExpressions is a list of label selector requirements. The requirements are ANDed. | false |
| matchLabels | map[string]string | matchLabels is a map of {key,value} pairs. A single {key,value} in the matchLabels
map is equivalent to an element of matchExpressions, whose key field is "key", the
operator is "In", and the values array contains only "value". The requirements are ANDed. | false |
A label selector requirement is a selector that contains values, a key, and an operator that relates the key and values.
| Name | Type | Description | Required |
|---|---|---|---|
| key | string | key is the label key that the selector applies to. | true |
| operator | enum | operator represents a key's relationship to a set of values.
Valid operators are In, NotIn, Exists and DoesNotExist. Enum: In, NotIn, Exists, DoesNotExist | true |
| values | []string | values is an array of string values. If the operator is In or NotIn,
the values array must be non-empty. If the operator is Exists or DoesNotExist,
the values array must be empty. This array is replaced during a strategic
merge patch. | false |
| Name | Type | Description | Required |
|---|---|---|---|
| name | string | Usdt name | true |
| path | string | Name of the traced binary | true |
| provider | string | Usdt provider name | true |
| args | []object | A list of function arguments to include in the trace output. | false |
| btfPath | string | path for a BTF file for the traced binary | false |
| message | string | A short message of 256 characters max that will be included
in the event output to inform users what is going on. | false |
| selectors | []object | Selectors to apply before producing trace output. Selectors are ORed. | false |
| tags | []string | Tags to categorize the event, will be include in the event output.
Maximum of 16 Tags are supported. | false |
| Name | Type | Description | Required |
|---|---|---|---|
| index | integer | Position of the argument. Format: int32 Minimum: 0 | true |
| type | enum | Argument type. Enum: auto, int, sint8, int8, uint8, sint16, int16, uint16, uint32, sint32, int32, ulong, uint64, size_t, long, sint64, int64, char_buf, char_iovec, skb, sock, sockaddr, socket, sockaddr_un, string, fd, file, filename, path, nop, bpf_attr, perf_event, bpf_map, user_namespace, capability, kiocb, iov_iter, cred, const_buf, load_info, module, syscall64, kernel_cap_t, cap_inheritable, cap_permitted, cap_effective, linux_binprm, data_loc, net_device, bpf_cmd, dentry, bpf_prog Default: auto | true |
| btfType | string | Type to use as the initial resolve type. For kprobe args it looks up the named struct
from the kernel BTF, casting the argument's type before traversing the resolve path.
For UprobeSpecs and UsdtSpecs it looks up the type from the BTF file defined by BTFPath. | false |
| btfTypeModule | string | Kernel module that contains the BTFType. This is used only for kprobe args.
The module must already be loaded and expose BTF in /sys/kernel/btf. | false |
| label | string | Label to output in the JSON | false |
| maxData | boolean | Read maximum possible data (currently 327360). This field is only used
for char_buff data. When this value is false (default), the bpf program
will fetch at most 4096 bytes. In later kernels (>=5.4) tetragon
supports fetching up to 327360 bytes if this flag is turned on Default: false | false |
| resolve | string | Resolve the path to a specific attribute Default: | false |
| returnCopy | boolean | This field is used only for char_buf and char_iovec types. It indicates
that this argument should be read later (when the kretprobe for the
symbol is triggered) because it might not be populated when the kprobe
is triggered at the entrance of the function. For example, a buffer
supplied to read(2) won't have content until kretprobe is triggered. Default: false | false |
| sizeArgIndex | integer | Specifies the position of the corresponding size argument for this argument.
This field is used only for char_buf and char_iovec types. Format: int32 Minimum: 0 | false |
| source | string | Source of the data, if missing the default if function arguments | false |
KProbeSelector selects function calls for kprobe based on PIDs and function arguments. The results of MatchPIDs and MatchArgs are ANDed.
| Name | Type | Description | Required |
|---|---|---|---|
| label | string | Human-readable selector label used in status and metrics. | false |
| macros | []string | A list of macros names, defined in spec.selectorsMacros.
Filters specified in macros will be appended to corresponding filters of the selector. | false |
| matchActions | []object | A list of actions to execute when this selector matches | false |
| matchArgs | []object | A list of argument filters. MatchArgs are ANDed. | false |
| matchBinaries | []object | A list of binary exec name filters. | false |
| matchCapabilities | []object | A list of capabilities and IDs | false |
| matchCapabilityChanges | []object | IDs for capabilities changes | false |
| matchData | []object | A list of argument filters. MatchData are ANDed. | false |
| matchNamespaceChanges | []object | IDs for namespace changes | false |
| matchNamespaces | []object | A list of namespaces and IDs | false |
| matchPIDs | []object | A list of process ID filters. MatchPIDs are ANDed. | false |
| matchParentBinaries | []object | A list of process parent exec name filters. | false |
| matchReturnActions | []object | A list of actions to execute when MatchReturnArgs selector matches | false |
| matchReturnArgs | []object | A list of argument filters. MatchReturnArgs are ANDed. | false |
| matchWorkloads | object | Workloads to match | false |
| Name | Type | Description | Required |
|---|---|---|---|
| action | enum | Action to execute.
The Override action has three variants, depending on what arguments are set
1. Override the return value of function
Supported hooks: kprobes, uprobes, lsm
Arguments: ArgError (return value)
2. Override the value of a register
Supported hooks: uprobes
Arguments: ArgRegs
3. Override a function call
Supported hooks: uprobes
Arguments: One of:
- ArgNewSymbol: override call to a new symbol (in the binary)
- ArgNewAddr: override call to a new address (in the binary)
- ArgNewOffset: override call to an offset (in the binary) Enum: Post, Sigkill, Override, GetUrl, DnsLookup, NoPost, Signal, TrackSock, UntrackSock, NotifyEnforcer, CleanupEnforcerNotification, Set | true |
| argError | integer | error value for override action Format: int32 | false |
| argFqdn | string | A FQDN to lookup for the dnsLookup action | false |
| argIndex | integer | An arg index for the set action Format: int32 | false |
| argNewAddr | integer | An arg value for the override action, uprobe only.
The new symbol's address.
Beware that the symbol MUST be binary compatible with the traced uprobe symbol. Format: int64 | false |
| argNewOffset | integer | An arg value for the override action, uprobe only.
The new symbol's offset.
Beware that the symbol MUST be binary compatible with the traced uprobe symbol. Format: int64 | false |
| argNewSymbol | string | An arg value for the override action, uprobe only.
The new symbol name.
Beware that the symbol MUST be binary compatible with the traced uprobe symbol. | false |
| argRegs | []string | An arg value for the override action, uprobe only. | false |
| argSig | integer | A signal number for signal action Format: int32 | false |
| argSock | integer | An arg index for the sock for trackSock and untrackSock actions Format: int32 | false |
| argUrl | string | A URL for the getUrl action | false |
| argValue | integer | An arg value for the set action Format: int32 | false |
| imaHash | boolean | Enable collection of file hashes from integrity subsystem.
Only valid with the post action. | false |
| kernelStackTrace | boolean | Enable kernel stack trace export. Only valid with the post action. | false |
| rateLimit | string | A time period within which repeated messages will not be posted. Can be
specified in seconds (default or with 's' suffix), minutes ('m' suffix)
or hours ('h' suffix). Only valid with the post action. | false |
| rateLimitScope | string | The scope of the provided rate limit argument. Can be "thread" (default),
"process" (all threads for the same process), or "global". If "thread" is
selected then rate limiting applies per thread; if "process" is selected
then rate limiting applies per process; if "global" is selected then rate
limiting applies regardless of which process or thread caused the action.
Only valid with the post action and with a rateLimit specified. | false |
| userStackTrace | boolean | Enable user stack trace export. Only valid with the post action. | false |
| Name | Type | Description | Required |
|---|---|---|---|
| operator | enum | Filter operation. Enum: Equal, NotEqual, Prefix, NotPrefix, Postfix, NotPostfix, GreaterThan, LessThan, GT, LT, Mask, SPort, NotSPort, SPortPriv, NotSportPriv, DPort, NotDPort, DPortPriv, NotDPortPriv, SAddr, NotSAddr, DAddr, NotDAddr, Protocol, Family, State, InMap, NotInMap, CapabilitiesGained, InRange, NotInRange, SubString, SubStringIgnCase, CelExpr, FileType, NotFileType | true |
| args | []integer | Position of the operator arguments (in spec file) to apply the filter to. | false |
| index | integer | Position of the argument (in function prototype) to apply the filter to. Format: int32 Minimum: 0 | false |
| values | []string | Value to compare the argument against. | false |
| Name | Type | Description | Required |
|---|---|---|---|
| operator | enum | Filter operation. Enum: In, NotIn, Prefix, NotPrefix, Postfix, NotPostfix | true |
| values | []string | Value to compare the argument against. | true |
| followChildren | boolean | In addition to binaries, match children processes of specified binaries. Default: false | false |
| Name | Type | Description | Required |
|---|---|---|---|
| operator | enum | Namespace selector operator. Enum: In, NotIn | true |
| values | []string | Capabilities to match. | true |
| isNamespaceCapability | boolean | Indicates whether these caps are namespace caps. Default: false | false |
| type | enum | Type of capabilities Enum: Effective, Inheritable, Permitted Default: Effective | false |
| Name | Type | Description | Required |
|---|---|---|---|
| operator | enum | Namespace selector operator. Enum: In, NotIn | true |
| values | []string | Capabilities to match. | true |
| isNamespaceCapability | boolean | Indicates whether these caps are namespace caps. Default: false | false |
| type | enum | Type of capabilities Enum: Effective, Inheritable, Permitted Default: Effective | false |
| Name | Type | Description | Required |
|---|---|---|---|
| operator | enum | Filter operation. Enum: Equal, NotEqual, Prefix, NotPrefix, Postfix, NotPostfix, GreaterThan, LessThan, GT, LT, Mask, SPort, NotSPort, SPortPriv, NotSportPriv, DPort, NotDPort, DPortPriv, NotDPortPriv, SAddr, NotSAddr, DAddr, NotDAddr, Protocol, Family, State, InMap, NotInMap, CapabilitiesGained, InRange, NotInRange, SubString, SubStringIgnCase, CelExpr, FileType, NotFileType | true |
| args | []integer | Position of the operator arguments (in spec file) to apply the filter to. | false |
| index | integer | Position of the argument (in function prototype) to apply the filter to. Format: int32 Minimum: 0 | false |
| values | []string | Value to compare the argument against. | false |
| Name | Type | Description | Required |
|---|---|---|---|
| operator | enum | Namespace selector operator. Enum: In, NotIn | true |
| values | []string | Namespace types (e.g., Mnt, Pid) to match. | true |
| Name | Type | Description | Required |
|---|---|---|---|
| namespace | enum | Namespace selector name. Enum: Uts, Ipc, Mnt, Pid, PidForChildren, Net, Time, TimeForChildren, Cgroup, User | true |
| operator | enum | Namespace selector operator. Enum: In, NotIn | true |
| values | []string | Namespace IDs (or host_ns for host namespace) of namespaces to match. | true |
| Name | Type | Description | Required |
|---|---|---|---|
| operator | enum | PID selector operator. Enum: In, NotIn | true |
| values | []integer | Process IDs to match. | true |
| followForks | boolean | Matches any descendant processes of the matching PIDs. Default: false | false |
| isNamespacePID | boolean | Indicates whether PIDs are namespace PIDs. Default: false | false |
| Name | Type | Description | Required |
|---|---|---|---|
| operator | enum | Filter operation. Enum: In, NotIn, Prefix, NotPrefix, Postfix, NotPostfix | true |
| values | []string | Value to compare the argument against. | true |
| followChildren | boolean | In addition to binaries, match children processes of specified binaries. Default: false | false |
| Name | Type | Description | Required |
|---|---|---|---|
| action | enum | Action to execute.
The Override action has three variants, depending on what arguments are set
1. Override the return value of function
Supported hooks: kprobes, uprobes, lsm
Arguments: ArgError (return value)
2. Override the value of a register
Supported hooks: uprobes
Arguments: ArgRegs
3. Override a function call
Supported hooks: uprobes
Arguments: One of:
- ArgNewSymbol: override call to a new symbol (in the binary)
- ArgNewAddr: override call to a new address (in the binary)
- ArgNewOffset: override call to an offset (in the binary) Enum: Post, Sigkill, Override, GetUrl, DnsLookup, NoPost, Signal, TrackSock, UntrackSock, NotifyEnforcer, CleanupEnforcerNotification, Set | true |
| argError | integer | error value for override action Format: int32 | false |
| argFqdn | string | A FQDN to lookup for the dnsLookup action | false |
| argIndex | integer | An arg index for the set action Format: int32 | false |
| argNewAddr | integer | An arg value for the override action, uprobe only.
The new symbol's address.
Beware that the symbol MUST be binary compatible with the traced uprobe symbol. Format: int64 | false |
| argNewOffset | integer | An arg value for the override action, uprobe only.
The new symbol's offset.
Beware that the symbol MUST be binary compatible with the traced uprobe symbol. Format: int64 | false |
| argNewSymbol | string | An arg value for the override action, uprobe only.
The new symbol name.
Beware that the symbol MUST be binary compatible with the traced uprobe symbol. | false |
| argRegs | []string | An arg value for the override action, uprobe only. | false |
| argSig | integer | A signal number for signal action Format: int32 | false |
| argSock | integer | An arg index for the sock for trackSock and untrackSock actions Format: int32 | false |
| argUrl | string | A URL for the getUrl action | false |
| argValue | integer | An arg value for the set action Format: int32 | false |
| imaHash | boolean | Enable collection of file hashes from integrity subsystem.
Only valid with the post action. | false |
| kernelStackTrace | boolean | Enable kernel stack trace export. Only valid with the post action. | false |
| rateLimit | string | A time period within which repeated messages will not be posted. Can be
specified in seconds (default or with 's' suffix), minutes ('m' suffix)
or hours ('h' suffix). Only valid with the post action. | false |
| rateLimitScope | string | The scope of the provided rate limit argument. Can be "thread" (default),
"process" (all threads for the same process), or "global". If "thread" is
selected then rate limiting applies per thread; if "process" is selected
then rate limiting applies per process; if "global" is selected then rate
limiting applies regardless of which process or thread caused the action.
Only valid with the post action and with a rateLimit specified. | false |
| userStackTrace | boolean | Enable user stack trace export. Only valid with the post action. | false |
| Name | Type | Description | Required |
|---|---|---|---|
| operator | enum | Filter operation. Enum: Equal, NotEqual, Prefix, NotPrefix, Postfix, NotPostfix, GreaterThan, LessThan, GT, LT, Mask, SPort, NotSPort, SPortPriv, NotSportPriv, DPort, NotDPort, DPortPriv, NotDPortPriv, SAddr, NotSAddr, DAddr, NotDAddr, Protocol, Family, State, InMap, NotInMap, CapabilitiesGained, InRange, NotInRange, SubString, SubStringIgnCase, CelExpr, FileType, NotFileType | true |
| args | []integer | Position of the operator arguments (in spec file) to apply the filter to. | false |
| index | integer | Position of the argument (in function prototype) to apply the filter to. Format: int32 Minimum: 0 | false |
| values | []string | Value to compare the argument against. | false |
Workloads to match
| Name | Type | Description | Required |
|---|---|---|---|
| containerSelector | object | ContainerSelector selects containers that this policy applies to.
A map of container fields will be constructed in the same way as a map of labels.
The name of the field represents the label "key", and the value of the field - label "value".
Currently, only the "name" field is supported. | false |
| hostSelector | object | HostSelector selects hosts that this policy applies to.
For now only ~ (none) and {} (all) is supported. Validations: | false |
| podSelector | object | PodSelector selects pods that this policy applies to | false |
ContainerSelector selects containers that this policy applies to. A map of container fields will be constructed in the same way as a map of labels. The name of the field represents the label “key”, and the value of the field - label “value”. Currently, only the “name” field is supported.
| Name | Type | Description | Required |
|---|---|---|---|
| matchExpressions | []object | matchExpressions is a list of label selector requirements. The requirements are ANDed. | false |
| matchLabels | map[string]string | matchLabels is a map of {key,value} pairs. A single {key,value} in the matchLabels
map is equivalent to an element of matchExpressions, whose key field is "key", the
operator is "In", and the values array contains only "value". The requirements are ANDed. | false |
A label selector requirement is a selector that contains values, a key, and an operator that relates the key and values.
| Name | Type | Description | Required |
|---|---|---|---|
| key | string | key is the label key that the selector applies to. | true |
| operator | enum | operator represents a key's relationship to a set of values.
Valid operators are In, NotIn, Exists and DoesNotExist. Enum: In, NotIn, Exists, DoesNotExist | true |
| values | []string | values is an array of string values. If the operator is In or NotIn,
the values array must be non-empty. If the operator is Exists or DoesNotExist,
the values array must be empty. This array is replaced during a strategic
merge patch. | false |
HostSelector selects hosts that this policy applies to. For now only ~ (none) and {} (all) is supported.
| Name | Type | Description | Required |
|---|---|---|---|
| matchExpressions | []object | matchExpressions is a list of label selector requirements. The requirements are ANDed. | false |
| matchLabels | map[string]string | matchLabels is a map of {key,value} pairs. A single {key,value} in the matchLabels
map is equivalent to an element of matchExpressions, whose key field is "key", the
operator is "In", and the values array contains only "value". The requirements are ANDed. | false |
A label selector requirement is a selector that contains values, a key, and an operator that relates the key and values.
| Name | Type | Description | Required |
|---|---|---|---|
| key | string | key is the label key that the selector applies to. | true |
| operator | enum | operator represents a key's relationship to a set of values.
Valid operators are In, NotIn, Exists and DoesNotExist. Enum: In, NotIn, Exists, DoesNotExist | true |
| values | []string | values is an array of string values. If the operator is In or NotIn,
the values array must be non-empty. If the operator is Exists or DoesNotExist,
the values array must be empty. This array is replaced during a strategic
merge patch. | false |
PodSelector selects pods that this policy applies to
| Name | Type | Description | Required |
|---|---|---|---|
| matchExpressions | []object | matchExpressions is a list of label selector requirements. The requirements are ANDed. | false |
| matchLabels | map[string]string | matchLabels is a map of {key,value} pairs. A single {key,value} in the matchLabels
map is equivalent to an element of matchExpressions, whose key field is "key", the
operator is "In", and the values array contains only "value". The requirements are ANDed. | false |
A label selector requirement is a selector that contains values, a key, and an operator that relates the key and values.
| Name | Type | Description | Required |
|---|---|---|---|
| key | string | key is the label key that the selector applies to. | true |
| operator | enum | operator represents a key's relationship to a set of values.
Valid operators are In, NotIn, Exists and DoesNotExist. Enum: In, NotIn, Exists, DoesNotExist | true |
| values | []string | values is an array of string values. If the operator is In or NotIn,
the values array must be non-empty. If the operator is Exists or DoesNotExist,
the values array must be empty. This array is replaced during a strategic
merge patch. | false |
Before you report a problem, make sure to retrieve the necessary information from your cluster.
Tetragon’s bugtool captures potentially useful information about your environment for debugging. The tool is meant to be used for debugging a single Tetragon agent node but can be run automatically in a cluster. Note that in the context of Kubernetes, the command needs to be run from inside the Tetragon Pod’s container.
Key information collected by bugtool:
You can collect information in a Kubernetes cluster using the Cilium CLI:
cilium sysdump
More details can be found in the Cilium docs.
The Cilium CLI sysdump command will automatically run tetra bugtool on each
nodes where Tetragon is running.
It’s also possible to run the bug collection tool manually with the scope of a
single node using tetra bugtool.
Identify the Tetragon Pod (<tetragon-namespace> is likely to be kube-system
with the default install):
kubectl get pods -n <tetragon-namespace> -l app.kubernetes.io/name=tetragon
Execute tetra bugtool within the Pod:
kubectl exec -n <tetragon-namespace> <tetragon-pod-name> -c tetragon -- tetra bugtool
Retrieve the created archive from the Pod’s filesystem:
kubectl cp -c tetragon <tetragon-namespace>/<tetragon-pod-name>:tetragon-bugtool.tar.gz tetragon-bugtool.tar.gz
Enter the Tetragon Container:
docker exec -it <tetragon-container-id> tetra bugtool
Retrieve the archive using docker cp:
docker cp <tetragon-container-id>:/tetragon-bugtool.tar.gz tetragon-bugtool.tar.gz
Execute tetra bugtool with Elevated Permissions:
sudo tetra bugtool
When debugging, it might be useful to change the log level. The default log level is controlled by the log-level option at startup:
--log-level=debug--log-level=traceIt is possible to change the log level of Tetragon’s DaemonSet Pods by setting
tetragon.debug to true.
It is possible to change the log level dynamically by using the tetra loglevel
sub-command. tetra needs access to Tetragon’s gRPC server endpoint which can
be configured via --server-address.
localhost. Also, it’s important to understand that this only changes the log
level of the single Tetragon instance targeted with --server-address and not
all Tetragon instances when it’s, for example, running as DaemonSet in a
Kubernetes environment.Get the current log level:
tetra loglevel get
Dynamically change the log level. Allowed values are
[trace|debug|info|warning|error|fatal|panic]:
tetra loglevel set debug
This page shows you how to monitor BPF programs statistics.
The BPF subsystem provides performance data for each loaded program and tetragon exports that in metrics or display that in terminal in top like tool.
The tetra command allows to display loaded BPF programs in terminal with:
tetra debug progs
The default output shows tetragon programs only and looks like:
2024-10-31 11:12:45.94715546 +0000 UTC m=+8.038098448
Ovh(%) Id Cnt Time Name Pin
0.00 22201 0 0 event_execve /sys/fs/bpf/tetragon/__base__/event_execve/prog
0.00 22198 0 0 event_exit_acct_process /sys/fs/bpf/tetragon/__base__/event_exit/prog
0.00 22200 0 0 event_wake_up_new_task /sys/fs/bpf/tetragon/__base__/kprobe_pid_clear/prog
0.00 22207 0 0 tg_cgroup_rmdir /sys/fs/bpf/tetragon/__base__/tg_cgroup_rmdir/prog
0.00 22206 0 0 tg_kp_bprm_committing_creds /sys/fs/bpf/tetragon/__base__/tg_kp_bprm_committing_creds/prog
0.00 22221 0 0 generic_kprobe_event /sys/fs/bpf/tetragon/syswritefollowfdpsswd/generic_kprobe/__x64_sys_close/prog
0.00 22225 0 0 generic_kprobe_event /sys/fs/bpf/tetragon/syswritefollowfdpsswd/generic_kprobe/__x64_sys_write/prog
0.00 22211 0 0 generic_kprobe_event /sys/fs/bpf/tetragon/syswritefollowfdpsswd/generic_kprobe/fd_install/prog
The fields have following meaning:
Ovh is system wide overhead of the BPF programId is global BPF ID of the program (as shown by bpftool prog)Cnt is count with number of BPF program executionsTime is sum of the time of all BPF program executionsPin is BPF program pin path in bpfffsIt’s possible to display all BPF programs with --all:
tetra debug progs --all
That has following output:
2024-10-31 11:19:37.720137195 +0000 UTC m=+7.165535117
Ovh(%) Id Cnt Time Name Pin
0.00 159 2 82620 event_execve -
0.00 171 68 18564 iter -
0.00 158 2 10170 event_wake_up_n -
0.00 164 2 4254 tg_kp_bprm_comm -
0.00 157 2 3868 event_exit_acct -
0.00 97 2 1680 -
0.00 35 2 1442 -
0.00 83 0 0 sd_devices -
0.00 9 0 0 -
0.00 7 0 0 -
0.00 8 0 0 -
0.00 87 0 0 sd_devices -
...
The bpffs mount and iterator object path are auto detected by default, but it’s possible to override them with –bpf-lib and and –bpf-lib options, like:
kubectl exec -ti -n kube-system tetragon-66rk4 -c tetragon -- tetra debug progs --bpf-dir /run/cilium/bpffs/tetragon/ --all --bpf-lib /var/lib/tetragon/
Note that there are other options to customize the behaviour:
tetra debug progs --help
Retrieve information about BPF programs on the host.
Examples:
- tetragon BPF programs top style
# tetra debug progs
- all BPF programs top style
# tetra debug progs --all
- one shot mode (displays one interval data)
# tetra debug progs --once
- change interval to 10 seconds
# tetra debug progs --timeout 10
- change interval to 10 seconds in one shot mode
# tetra debug progs --once --timeout 10
Usage:
tetra debug progs [flags]
Aliases:
progs, top
Flags:
--all Get all programs
--bpf-dir string Location of bpffs tetragon directory (auto detect by default)
--bpf-lib string Location of Tetragon libs, btf and bpf files (auto detect by default)
-h, --help help for progs
--no-clear Do not clear screen between rounds
--once Run in one shot mode
--timeout int Interval in seconds (delay in one shot mode) (default 1)
The BPF subsystem provides performance data for each loaded program and tetragon exports that in metrics.
For each loaded BPF program we get:
run count which counts how many times the BPF program was executedrun time which sums the time BPF program spent in all its executionsHence for each loaded BPF program we export 2 related metrics:
tetragon_overhead_time_program_total[namespace,policy,sensor,attach]tetragon_overhead_cnt_program_total[namespace,policy,sensor,attach]Each loaded program is identified by labels:
namespace is policy Kubernetes namespacepolicy is policy namesensor is sensor nameattach is program attachment nameIf we have generic_kprobe sensor attached on __x64_sys_close kernel function
under syswritefollowfdpsswd policy, the related metrics will look like:
tetragon_overhead_program_runs_total{attach="__x64_sys_close",policy="syswritefollowfdpsswd",policy_namespace="",sensor="generic_kprobe"} 15894
tetragon_overhead_program_seconds_total{attach="__x64_sys_close",policy="syswritefollowfdpsswd",policy_namespace="",sensor="generic_kprobe"} 1.03908217e+08
Note that the BPF programs statistics are not enabled by default, because they introduce extra overhead, so it’s necessary to enable them manually.
Either with sysctl:
sysctl kernel.bpf_stats_enabled=1
and make sure you disable the stats when it’s no longer needed:
sysctl kernel.bpf_stats_enabled=0
Or with following tetra command:
tetra debug enable-stats
^C
where the stats are enabled as long as the command is running (sleeping really).
The setup steps live in gRPC TLS / mTLS. This page covers the three errors operators hit most often.
x509: certificate signed by unknown authoritySeen on the client during the TLS handshake.
Cause — tetra does not trust the CA that signed the server certificate.
Fix — pass the CA bundle that issued the server cert:
tetra --tls-ca-cert-files ca.crt ...
When the chart auto-provisioned the cert, copy ca.crt out of the Secret:
kubectl -n kube-system get secret tetragon-grpc-server-cert \
-o jsonpath='{.data.ca\.crt}' | base64 -d > ca.crt
tls: bad certificateSeen in the agent logs while the client sees connection closed.
Cause — the server runs in mTLS mode (requireClientCert=true) and the
client either presented no certificate or one signed by a CA the agent does
not trust.
Fix — issue a client certificate from the same CA, then pass both halves:
tetra --tls-cert-file client.crt --tls-key-file client.key ...
x509: certificate is valid for *.tetragon-grpc.cilium.io, not <host>Seen on the client when the chart auto-provisioned the server cert.
Cause — the auto-issued cert uses a wildcard SAN over a synthetic domain, but the dial target is a different hostname or IP.
Fix — override SNI to match the wildcard:
tetra --tls-server-name node.tetragon-grpc.cilium.io ...
To use your own hostnames or IPs instead, add them through
tetragon.grpc.tls.server.extraDnsNames or extraIpAddresses and roll out
the chart.
This page presents a comprehensive threat model for Tetragon, a subproject within the Cilium family. The objective of this threat model is to help users and operators understand the security implications of Tetragon’s architecture, identify potential attack vectors, and implement effective defensive controls. Tetragon is a runtime security enforcement and observability tool that utilizes eBPF to deliver deep visibility into system behavior and enforce security policies at the kernel level. A good understanding of this threat model requires familiarity with Kubernetes architectural concepts, eBPF fundamentals, and Tetragon’s overall architecture. The model addresses multiple deployment scenarios, including Kubernetes-based deployments using DaemonSets, standalone containerized agents, and systemd-managed service deployments on individual hosts.
Tetragon Overview Diagram
This analysis evaluates threats associated with five distinct attacker profiles, each representing varying levels of access and privilege within the system. These profiles encompass attackers operating within Kubernetes workloads, individuals with limited host privileges, attackers with root-equivalent access, attackers who have compromised the Kubernetes API server, and network-based attackers capable of intercepting or manipulating network traffic. The threat model assumes Tetragon operates on fully patched systems with appropriate security hardening, including Kubernetes security best practices where applicable. This baseline assumption enables a focus on threats specific to Tetragon’s design and operation, rather than general system vulnerabilities.
Tetragon supports multiple deployment architectures, each introducing a unique attack surface that must be evaluated as part of the overall security posture. In Kubernetes environments, Tetragon is deployed as a DaemonSet, ensuring that an agent runs on every node. Tetragon can also run as a standalone agent, either containerized or managed by systemd, offering flexibility for non-Kubernetes environments. The Kubernetes DaemonSet deployment integrates deeply with the Kubernetes API and relies on it for policy distribution and management. This integration enables centralized control but also introduces dependencies on the security of the Kubernetes control plane. In contrast, standalone deployments necessitate alternative mechanisms for policy management and event collection, which may introduce vulnerabilities related to local file access and network communications.
The Tetragon agent is the primary component responsible for loading eBPF programs into the kernel, collecting events, and enforcing configured policies. Because of its privileged position within the system, the agent becomes a high-value target for attackers seeking to evade detection or manipulate security controls.
In Kubernetes deployments, configuration is primarily managed via two custom resource definitions (CRDs): TracingPolicy and TracingPolicyNamespaced.
These CRDs enable centralized policy management via the Kubernetes API but require strict RBAC to prevent unauthorized policy changes. In standalone deployments, configuration relies on YAML files stored directly on the host system, making security dependent on filesystem permissions and host access controls.
The agent can expose a gRPC endpoint that listeners may attach to. The gRPC endpoint can be configured to listen on either a Unix domain socket (UDS) or a local network port. The UDS approach generally provides better security isolation compared to network-based listening. However, both still require rigorous access control measures to prevent unauthorized interception of event streams.
Event export mechanisms constitute a significant aspect of the agent’s attack surface. Tetragon can emit events via multiple channels, including standard output streams for Kubernetes container logging, JSON log files, and gRPC streams over network ports. Each export method necessitates robust security controls to safeguard the confidentiality of event data, which may include sensitive information about system behavior and detected security incidents. The Tetragon Prometheus metrics endpoint also introduces a potential vector for information disclosure. Although these metrics do not directly reveal security events, they can disclose details about Tetragon’s configuration, performance characteristics, and operational state, which may assist attackers during reconnaissance.
The Tetragon Operator plays a vital role in Kubernetes-based deployments by managing the lifecycle of custom resource definitions. Its privileged access to the Kubernetes API server renders it a sensitive component from a security standpoint.
The following custom resources are registered by the Tetragon Operator:
The PodInfo CRD maintained by the operator functions as a key-value store mapping Pod IP addresses to workload objects, enabling Tetragon to attribute network activity and other events to specific Kubernetes resources.
From an architectural security perspective, the operator’s responsibility for distributing policies across the cluster implies that a compromise of the operator could facilitate cluster-wide policy manipulation. Recognizing this centralized control function is crucial for implementing effective protective measures and monitoring mechanisms.

Kubernetes Workload Attacker Diagram
Consider an adversary who has compromised an application in the cluster and can execute arbitrary code in that container’s context. Such scenarios typically result from vulnerabilities in exposed services, supply-chain compromises affecting container images, or the exploitation of application-level flaws. In this analysis, the attacker is assumed to operate without elevated Kubernetes privileges, without additional Linux capabilities beyond the container default set, and without direct access to host namespaces or filesystems.
In this context, the attacker’s primary capability against Tetragon is to generate events that require processing, storage, and potential export by the monitoring infrastructure. By deliberately creating activities that maximize event volume, the attacker may attempt to overwhelm Tetragon’s event processing pipeline, leading to event loss, performance degradation, or storage exhaustion. This denial-of-service attack vector exploits Tetragon’s core requirement to observe and record security-relevant activities, thereby turning a fundamental strength into a potential vulnerability.
Current analysis indicates that such attackers cannot directly compromise Tetragon’s integrity or availability beyond denial-of-service scenarios. The isolation enforced by container boundaries, together with Tetragon’s operation at the kernel level, prevents workload-level attackers from manipulating Tetragon’s eBPF programs, configuration, or core functionality. Nevertheless, the denial-of-service vector remains a significant concern that requires operational controls.
Recommended controls:
Proactive monitoring can mitigate workload-based denial-of-service attacks. Operators are encouraged to monitor and alert on dropped events via Tetragon Health Metrics. Some relevant metrics include:
tetragon_events_totaltetragon_observer_ringbuf_events_lost_totaltetragon_map_in_use_gaugetetragon_bpf_missed_events_totalThe event throttling feature offers protection against event floods. This
feature monitors event generation rates per cgroup and automatically restricts
further event posting when configurable thresholds are surpassed. Upon
activation, the system generates a THROTTLE_START event to inform operators of
the condition. Operators should monitor these throttling events, as they may
indicate ongoing attacks, though they can also result from legitimate
high-activity workloads. Event throttling is applied uniformly across all
workloads on a node, ensuring that no single workload monopolizes
event-processing resources.

Limited Privilege Host Attacker Diagram
A limited-privilege host attacker can escalate beyond container boundaries and access host namespaces and resources, but lacks the root privileges required to manipulate kernel state or disable system services. Such scenarios may result from privilege escalation paths, including container escapes that yield non-privileged host access, compromise of services with elevated Linux capabilities, or exploitation of vulnerabilities that grant specific privileged operations without full root access.
The threats posed by a limited-privilege host attacker depend on the specific privileges and access they obtain.
/var/run/tetragon/tetragon.sock, they can interact with Tetragon’s gRPC API,
enabling them to read and potentially modify current tracing policies. Such
access undermines Tetragon’s integrity by allowing the attacker to disable
monitoring, adjust policies to evade detection, or inject policies that generate
misleading events to confuse security teams. The default socket permissions of
0660 restrict access to the user and group running the Tetragon agent, assuming
no other processes share those credentials.localhost interface could connect to this port and obtain the same
policy-manipulation capabilities as with Unix socket access, without requiring
specific filesystem permissions. This expanded attack surface makes
network-based gRPC exposure particularly risky and generally unsuitable for
production environments unless robust authentication is implemented.Tetragon’s current design does not offer comprehensive protection against all
forms of kernel-level exploitation. For example, an attacker who acquires the
CAP_SYS_BPF capability can load arbitrary eBPF programs into the kernel.
Although the eBPF verifier enforces security boundaries, historical evidence
demonstrates that verifier bypasses are possible, potentially enabling malicious
programs to compromise kernel integrity. Tetragon cannot prevent or mitigate
such attacks when they succeed because the attacker operates at the same kernel
level as Tetragon’s monitoring infrastructure. This limitation is an inherent
constraint of eBPF-based security tools within the standard Linux security
model.
Recommended controls:
0600(rw-------) permissions appropriately restrict access, and operators
should resist any pressure to relax these restrictions even for operational
convenience. If multiple processes need access to events, the preferred approach
is to stream events over gRPC with appropriate access controls, rather than
relying on lax filesystem permissions.
Kubernetes API Server Attacker Diagram
An attacker who compromises the Kubernetes API server or acquires credentials for API access obtains substantial control over Tetragon’s operations in Kubernetes-based deployments. The API server serves as the control plane for policy distribution, establishing a critical trust boundary within Tetragon’s security model. As a result:
Recommended controls:

Root-Equivalent Host Attacker Diagram
An attacker with root privileges on a host running Tetragon gains complete control of the system, rendering all local security controls ineffective. This scenario represents the worst-case outcome from a host security perspective, as no technical controls can reliably protect against a fully privileged adversary. With root access, an attacker can fully manipulate the local Tetragon agent, including disabling it, altering its configuration to evade monitoring, or injecting false events into the event stream to mislead security teams. The eBPF programs that Tetragon uses for monitoring can be unloaded, replaced, or modified without restriction. Event export mechanisms may be redirected, disabled, or filtered to conceal malicious activity. Consequently, no security observability data from a root-compromised node can be considered trustworthy, as the attacker can manipulate all aspects of data collection and export. Tetragon records credentials such as user IDs and Linux capabilities only at process creation (exec time) and solely for the main thread. As a result, credentials reported in Tetragon events reflect the state at process creation, not necessarily at the time of the event. A privileged attacker can exploit this by launching processes with benign credentials and subsequently using setuid, setgid, or capability manipulation system calls to escalate privileges. Events from such processes will appear to originate from unprivileged contexts, potentially misleading security analysts regarding the true nature of the activity. The consequences of root compromise extend beyond the local node in Kubernetes environments. The service account token mounted in the Tetragon agent’s container, or accessible through its execution context, provides authentication credentials for communicating with the Kubernetes API server. A root-level attacker can extract this token to query the API server, potentially enumerating deployed policies, examining configurations of other nodes, or collecting intelligence about the broader environment. The permissions assigned to this service account define the scope of possible API operations, but even read-only access can yield valuable reconnaissance information.
Recommended control:
The Tetragon Operator should not be deployed on nodes hosting untrusted workloads, as a compromised workload could compromise the operator if both share a node. Instead, the operator should be scheduled exclusively on control plane nodes using appropriate node selectors, taints, and tolerations. This scheduling constraint ensures that a compromised workload does not provide a pathway to operator compromise, thereby limiting an attacker’s ability to exploit operator privileges for cluster-wide policy manipulation.

Network Attacker Diagram
A network attacker with man-in-the-middle capabilities can intercept, inspect, and potentially modify traffic between Tetragon components and external systems. This attacker profile is especially relevant in environments where Tetragon exports data across network boundaries or where monitoring infrastructure spans several network segments. The Prometheus metrics endpoint exposed by Tetragon constitutes a potential vector for information disclosure. Although these metrics do not directly include security events or detailed observability data, they provide operational insights into Tetragon’s performance, configuration, and state. A sophisticated attacker could analyze these metrics over time to infer policy changes, identify periods of high activity that may conceal attack traffic, or assess the monitoring system’s capacity limits to plan denial-of-service attacks. More significant concerns arise regarding the risks of exporting security events. If Tetragon transmits events to external collectors, SIEM platforms, or object storage systems without encryption in transit, a network attacker can intercept these event streams and obtain comprehensive insight into security monitoring. This access reveals monitored activities, policy enforcement decisions, detected anomalies, and incident response patterns. With this intelligence, attackers can analyze the security posture in detail, identify blind spots, evade detection patterns, and time attacks to exploit operational conditions that may reduce detection likelihood and integrity risks.
Recommended controls:
Beyond the specific attacker profiles discussed above, effective operation of Tetragon in production environments also requires attention to several cross-cutting security concerns. Security events often contain sensitive information about system behavior, user activities, process execution patterns, and network communications. This data needs protection from unauthorized disclosure through appropriate access controls on storage systems, encryption in transit and at rest, and careful consideration of data retention and destruction policies. Organizations subject to regulatory requirements should consider how Tetragon event data intersects with those requirements.
Policy management is critical because policies determine what Tetragon monitors and enforces. Change control processes should govern policy updates, ensuring that modifications are reviewed, tested in non-production environments, and approved before deployment. Policy validation mechanisms can identify common errors such as syntax issues or references to nonexistent resources, but comprehensive validation of policy logic and effectiveness requires testing against representative workloads. Users should maintain thorough policy documentation that explains each policy’s intent and expected behavior to facilitate review and troubleshooting.
Tetragon generates events that can be incorporated into existing incident response workflows, SIEM platforms, and security analytics tools. The volume, format, and semantic content of these events influence the success of integration. Users should implement appropriate event filtering, aggregation, and enrichment to ensure Tetragon data is actionable within their operational context. Excessive false positives can lead to alert fatigue and undermine security effectiveness, highlighting the importance of tuning and validating detection rules.
While eBPF provides unparalleled visibility and enforcement capabilities, its security is still tied to the integrity of the adjacent environment it operates in, particularly the host operating system and the Kubernetes control plane. Implementing mitigation strategies that encompass the recommended controls in this threat model will ensure Tetragon continues to remain a trusted source of truth. Operators should read recommendations provided in this threat model and assess which potential controls are relevant for them.
As Tetragon evolves, new features and capabilities may expand the attack surface or alter the threat landscape. Users should remain informed about Tetragon security updates, engage with the community to exchange threat intelligence and defensive strategies, and periodically reassess their deployments in light of emerging threats. The Tetragon community encourages feedback on this threat model and invites users to report any threats not addressed in this analysis. Security concerns should be communicated to the private security mailing list at security@cilium.io in accordance with responsible disclosure practices.
Security Observability with eBPF - Jed Salazar & Natália Réka Ivánkó, OReilly, 2022
Tetragon 1.0: Kubernetes Security Observability & Runtime Enforcement with eBPF - Thomas Graf, 2023
Tutorial: Setting Up a Cybersecurity Honeypot with Tetragon to Trigger Canary Tokens - Dean Lewis, 2023
Can I use Tetragon without Cilium? - Dean Lewis, 2023
Detecting a Container Escape with Cilium and eBPF - Natália Réka Ivánkó, 2021
Detecting and Blocking log4shell with Isovalent Cilium Enterprise - Jed Salazar, 2021
Getting Started with Tetragon - Natália Réka Ivánkó, Roland Wolters, Raphaël Pinson
Exploring Tetragon - A Security Observability Tool for Kubernetes, Docker, and Linux - Ivan Velichko
eBPF for Runtime Enforcement | Tetragon Introduction and Overview - Rawkode Academy
Restrict Access to Secure Files with Tetragon | eBPF Runtime Enforcement - Rawkode Academy